🔍 How to Use Zight's Productivity Calculator
Here's how to accurately calculate your productivity savings and understand their true value. You'll get precise metrics that help justify visual communication tools and demonstrate ROI for your workflow optimization.
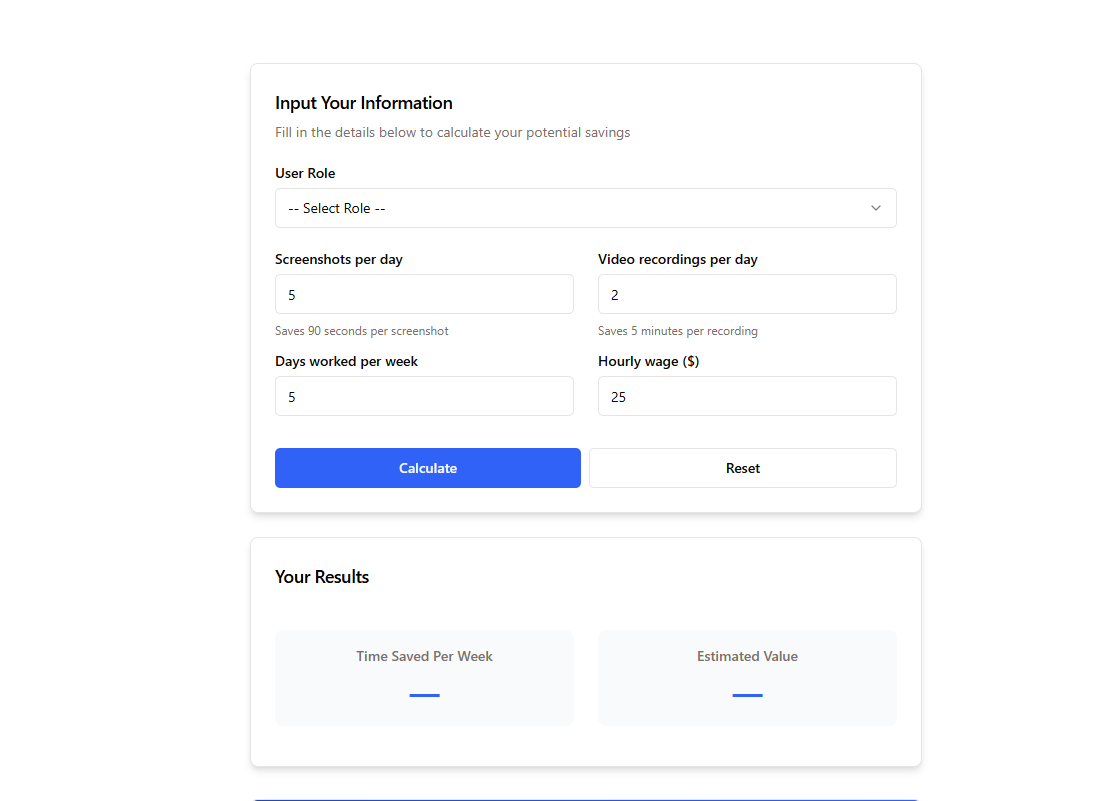
Select Your Role
Choose your job title from the dropdown menu. This automatically loads industry-specific default values optimized for your position — whether customer support, CEO, realtor, marketing, or HR, among others.
Input Screenshots & Screen Recordings
Enter how many screenshots you take and screen recordings you create. Each screenshot saves approximately 90 seconds, while each screen recording saves around 5 minutes of communication time. Be realistic with both numbers for accurate results.
Set Your Schedule & Rate
Enter your workweek on the left (typically 5 days) and hourly wage on the right. Include benefits and overhead in your rate for the most comprehensive financial impact calculations.
Calculate & Analyze Results
Click "Calculate" to see your weekly time savings and estimated dollar value. Use the "Reset" button to test different scenarios. You can review your weekly time savings (displayed as minutes) and estimated monetary value - with a detailed breakdown of hourly, monthly, and yearly savings.
Why Choose Zight's Productivity Calculator?
Our specialized calculator will help you transform abstract productivity gains into concrete metrics by analyzing your visual communication frequency to specifically quantify the ROI of screenshots and screen recordings. Here are a few reasons you should use it:
✅ Instant ROI Metrics – See your projected weekly, monthly, and yearly savings in both time and monetary value the moment you click “Calculate.”
✅ Role-Specific Accuracy – Pre-configured defaults for different job functions ensure realistic baseline calculations tailored to your industry.
✅ Zero Setup Required – No downloads, installations, or complex configurations — just input your data and get actionable insights immediately.
✅ Weighted Analysis – Considers the fixed time savings of screenshots (90 seconds) and screen recordings (5 minutes), revealing the true impact of visual communication.
✅ Flexible Scenarios – Test different visual communication frequencies with easy reset options to compare savings across various usage patterns.
✅ Total Privacy – All calculations happen locally in your browser with no data storage or personal information collection.

Perfect for Different Professional Use Cases
For Customer Support Representatives
Calculate how visual communication saves you time per ticket. Input how many screenshots and screen recordings you create to show customers exactly what to do instead of writing lengthy instructions, and see exactly how many hours you reclaim weekly.
For CEOs and Business Leaders
Measure the time saved when using visual summaries instead of lengthy reports or meetings. Input your visual communication frequency to discover the monetary value of getting your point across faster with screenshots and recordings.
For Healthcare Specialists
Track how visual patient education tools reduce your consultation time. Calculate the minutes saved with screenshots and recordings when explaining procedures, medications, or care instructions visually instead of verbally.
For Project Managers
Measure the hours saved using visual status updates versus writing detailed reports. Input your screenshot and recording frequency to see how visual communication reduces administrative burden and increases productive focus.
For Marketing Professionals
Calculate productivity gains from visual communication tools. Track the hours saved in campaign planning, execution, and reporting when using screenshots and screen recordings instead of lengthy emails and meetings.
💼 Boost Your Productivity with Zight's Premium Tools
Ready to measure the real impact of visual communication on your workflow? These Zight tools transform how you work, collaborate, and communicate. You can then use our productivity calculator to quantify exactly how these visual tools save you time and money across your daily workflow improvements.
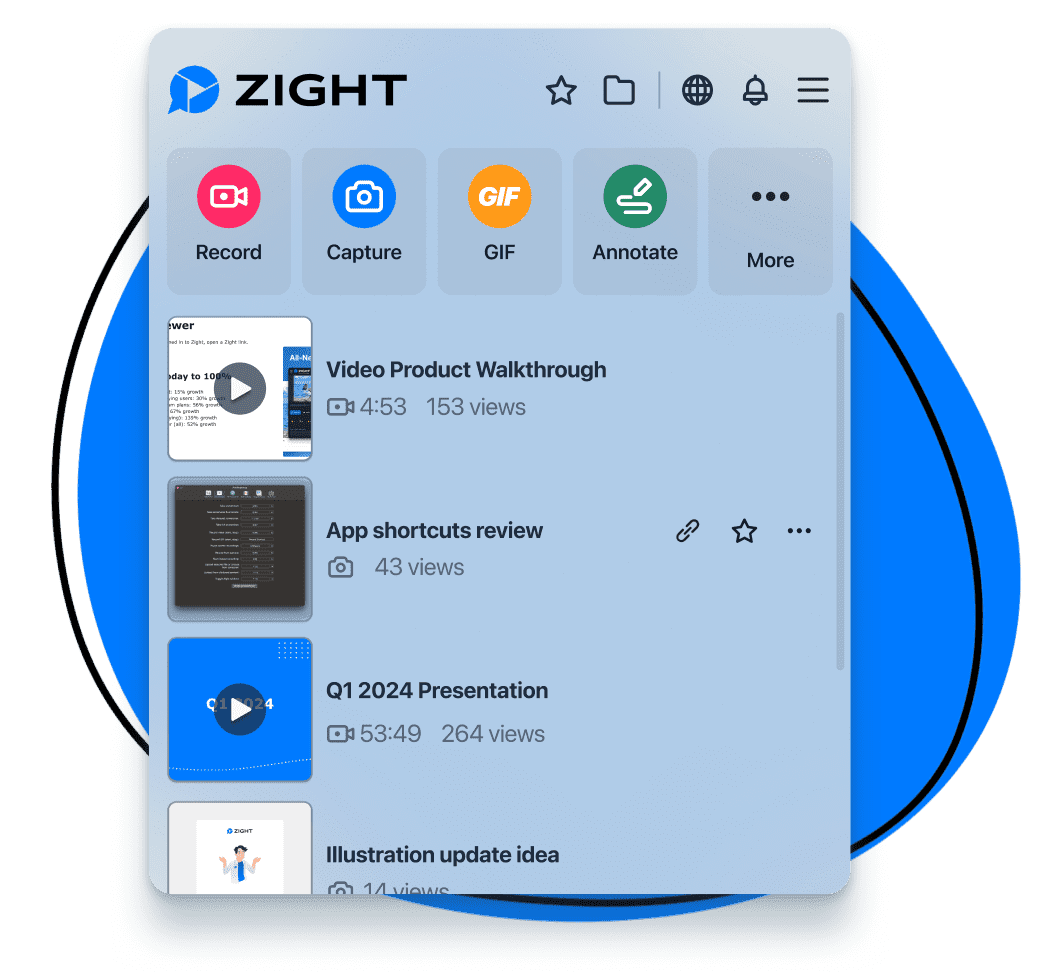
📸 Screenshot Tool – Capture and annotate precise screen images instantly for visual documentation
🎥 Screen & Webcam Recording – Create professional videos that eliminate repetitive explanations
🎬 GIF Maker – Design dynamic animations that communicate concepts in seconds
🤖 Smart Actions – Transform videos into meeting notes, checklists, and articles automatically
✂️ Video Editing – Polish content with professional tools for seamless visual narratives
🎙️ Audio Recording – Capture high-quality system and microphone audio for rich content
📬 Request Video – Collect personalized video responses without scheduling meetings
Unlock More Tools
Expand your toolkit with these additional free converters and utilities.
Start Measuring Your Productivity ROI Now!
Tired of guessing how much time visual communication actually saves you? Every tool claims to boost efficiency, but without real data, you're shooting in the dark. Use Zight's productivity calculator to measure the exact hours and dollars saved by screenshots and screen recordings in your daily workflow.
Calculate Your Productivity NowFAQs About Zight's Productivity Calculator
Just an internet connection and any web browser — no downloads, installations, or special software required. You can access the calculator for free from your desktop, laptop, tablet, or smartphone.
Your calculations happen locally in your browser, so there’s no account creation or personal data storage involved.
Our calculator provides estimates based on your input data — the accuracy depends on how realistic your numbers are.
We recommend using actual figures for how many screenshots and recordings you create rather than ideal scenarios. The tool applies fixed time savings (90 seconds per screenshot, 5 minutes per recording) across your work schedule to project weekly, monthly, and yearly benefits.
Absolutely! Use the “Reset” button to test various scenarios with different visual communication frequencies.
For example, a customer support rep could compare creating 5 versus 10 screenshots daily, or a developer might evaluate making 3 versus 6 screen recordings weekly.
By adjusting the number of screenshots and recordings, you can quantify which visual communication patterns offer the best ROI for your specific role.
Think about how often you currently explain things in writing that could be shown visually. Count how many emails, messages, or documents you create daily that could be replaced with screenshots or recordings.
For example, if you typically send 20 emails daily and estimate that half could be simplified with visuals, you might input 10 screenshots.
If you conduct 3 training sessions weekly that could be recorded instead, you might input 3 screen recordings per week (or about 0.6 per day). Be conservative in your estimates for more reliable projections.
For business decision-making, yes — include your total compensation package. This gives a more accurate picture of your true cost to the organization.
For personal productivity tracking, your base hourly rate works fine. Choose based on whether you’re justifying tool purchases to management or tracking personal efficiency.
Currently, the calculator displays results instantly but doesn’t offer export functionality. You can take a screenshot of your results for presentations or reports.
You can also always recalculate with the same inputs to recreate your data. For ongoing tracking, note your inputs and results in a spreadsheet or document.
Calculate Time and Cost Savings with Zight's Online Productivity Calculator
Time is money — but how much exactly?
For professionals juggling multiple responsibilities, precisely measuring productivity improvements remains a persistent challenge. You might feel more efficient after implementing new productivity apps and visual communication tools, but without concrete metrics, it’s impossible to quantify the actual value of these changes.
Zight’s Productivity Calculator solves this problem by converting abstract efficiency gains into tangible numbers to help you understand exactly how much time and money you’re saving with each workflow improvement.
What is this Productivity Calculator, and Why Use It?
In most cases, productivity is measured using a basic productivity formula: Productivity = Total Output / Total Input, which helps organizations determine how efficiently they’re converting resources (like time, labor, or materials) into valuable outputs (such as completed tasks, products, or services). Traditional productivity formulas focus on measuring overall output and employee productivity, like a QA inspector checking 800 bottle caps in eight hours.
However, Zight’s calculator focuses specifically on time savings and their monetary value. So, instead of just tracking what you produce, it helps you understand how much time and money you reclaim through visual communication.
The calculator analyzes four key components:
- Your role
- How many screenshots and screen recordings you create
- Your work schedule
- Your compensation rate
It then processes these inputs to deliver concrete metrics showing weekly time savings and their dollar value to provide actionable business intelligence.
How to Calculate Productivity with Zight Online
This is a simple platform that will give you detailed productivity reports. It is free, browser-based, and accessible via any device with an internet connection.
In the following sections, we will explore how this tool works using the available parameters. Specifically, we’ll use the example of a Marketing & Sales role and calculate productivity and how much we can save if we adopt visual communication tools that save time and money.
Note: You can select your role to understand your realistic operational efficiency.
Step 1: Select Your Role

Choose “Marketing & Sales” from the dropdown menu. This selection automatically populates role-specific default values to create a realistic starting point based on typical sales workflows.
For this role, the calculator will suggest you take around 6 screenshots and 4 screen recordings daily, working five days a week. You can leave these default values as they are if they seem reasonable for your workflow, but adjust your hourly wage if you earn more or less than the default $25.
To continue this demonstration, we will adjust these inputs to better reflect our specific sales representative’s communication patterns (you can do the same and use realistic values that complement your role and current processes):
Step 2: Enter Your Visual Communication Frequency
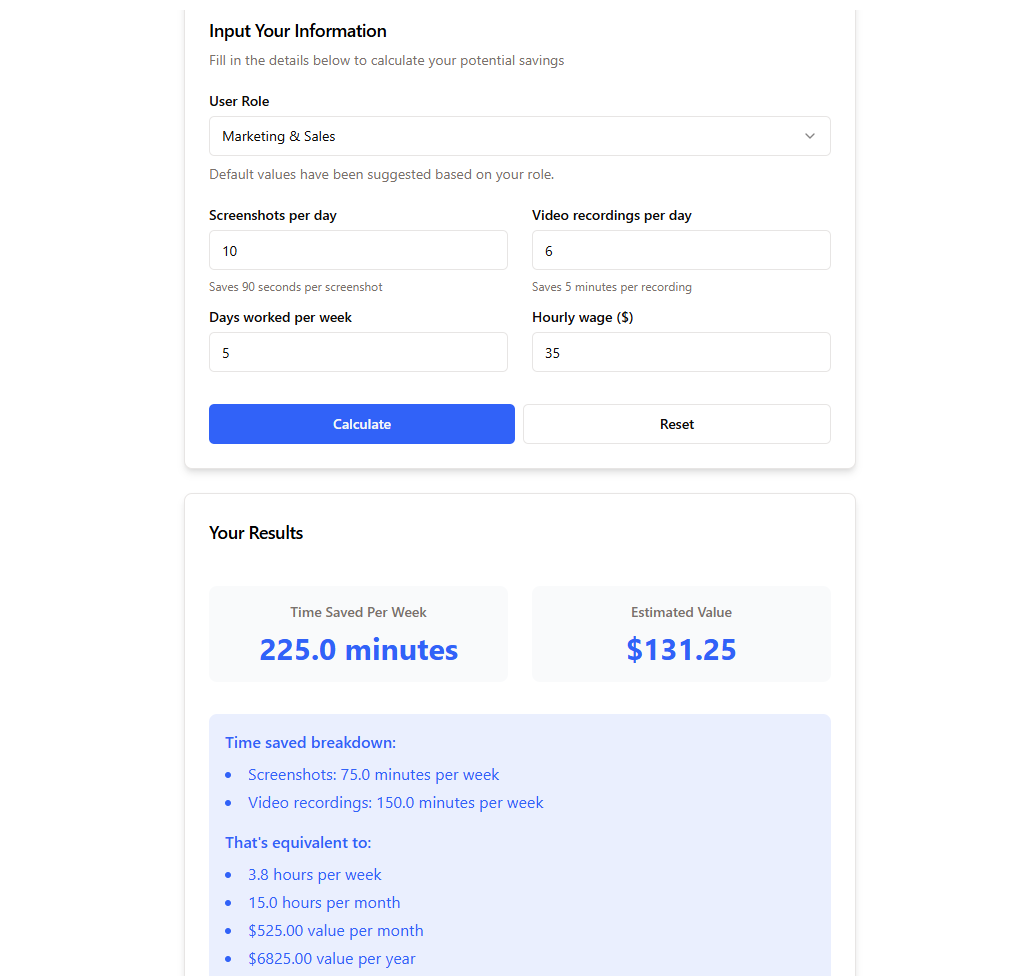
For our sales representative example, we’ll enter 10 screenshots and 6 screen recordings daily:

The thinking here is simple — our sales rep uses screenshots with annotations to quickly highlight product features, explain dashboard elements, and provide visual feedback on proposals. Each annotated screenshot saves approximately 90 seconds compared to typing out explanations.
For more complex explanations, they create screen recordings to demonstrate product workflows, showcase features in action, and provide personalized demo videos. Each recording saves approximately 5 minutes compared to written explanations or scheduling live demonstrations.
By using Zight’s screenshot app, screen recorder, and GIF maker for online visual communication, they can instantly answer prospect questions with annotated visuals demonstrating solutions. Thus, they have eliminated lengthy email chains and reduced miscommunication!
Step 3: Confirm Your Work Week

When measuring our productivity gains, we will maintain the five-day work week (you can change yours accordingly). Our representative maintains a standard full-time schedule, ensuring calculations reflect typical availability.
Step 4: Add Your Hourly Rate

In our example, we’ll use $35 for the hourly wage. This better represents the total compensation package of an experienced sales professional, including benefits and incentives. You should adapt the rate to capture your earnings accurately.
Step 5: Calculate and Analyze Your Results

Click the “Calculate” button to reveal your productivity metrics. In our example with 10 screenshots (saving 90 seconds each) and 6 screen recordings (saving 5 minutes each) daily, we get these impressive results:
- Time Saved Per Week: 225.0 minutes (3.8 hours)
- Estimated Value: $131.25 per week
The detailed breakdown shows:
- Screenshots: 75.0 minutes saved per week
- Video recordings: 150.0 minutes per week
That’s equivalent to:
- 3.8 hours per week
- 15.0 hours per month
- $525.00 value per month
- $6,825.00 value per year
These results demonstrate that visual communication tools save our sales representative nearly 200 hours annually, translating to significant cost savings of over $6,800 that far outweigh the investment in Zight’s platform.
Step 6: Apply Your Insights
Armed with concrete productivity metrics, you gain powerful capabilities to transform your professional life and organizational impact. As the key to achieving desired outcomes, you can use these productivity measurements to:
- Drive Data-Based Decision Making: With precise ROI calculations, you can confidently champion visual communication tools that deliver measurable results and secure approval from even the most numbers-focused executives.
- Create Compelling Business Cases: When requesting resources for productivity improvements, a presentation showing “$12,600 annual productivity savings” carries substantially more weight than vague promises of “improved efficiency” using a standard productivity formula.
- Optimize Resource Allocation: Identify which visual communication methods deliver the highest returns. You can test different scenarios in the calculator, comparing screenshot versus screen recording usage to maximize your time-to-value ratio.
- Set Realistic Performance Goals: Rather than arbitrary productivity targets, establish benchmarks grounded in actual data. These metrics can inform realistic communication goals, personal development plans, and organizational KPIs that inspire confidence and employee satisfaction.
- Quantify Professional Growth: Document your increasing value to the organization over time. Regular productivity calculations create a compelling narrative of your growing contribution to provide evidence for performance reviews, promotion discussions, and salary negotiations.
- Demonstrate Leadership Vision: Position yourself as a forward-thinking leader focused on measurable results for business performance. With such productivity improvements, you demonstrate the strategic thinking that distinguishes exceptional leaders from merely competent managers.
Wrapping Up
Numbers tell stories that feelings cannot. The Zight Productivity Calculator will help you translate your visual communication into financial gains.
With a free tool and a few steps, you will take your productivity journey beyond guesswork — measure it precisely with Zight’s calculator, then explore how other visual communication tools can multiply these gains by streamlining collaboration and eliminating communication barriers.