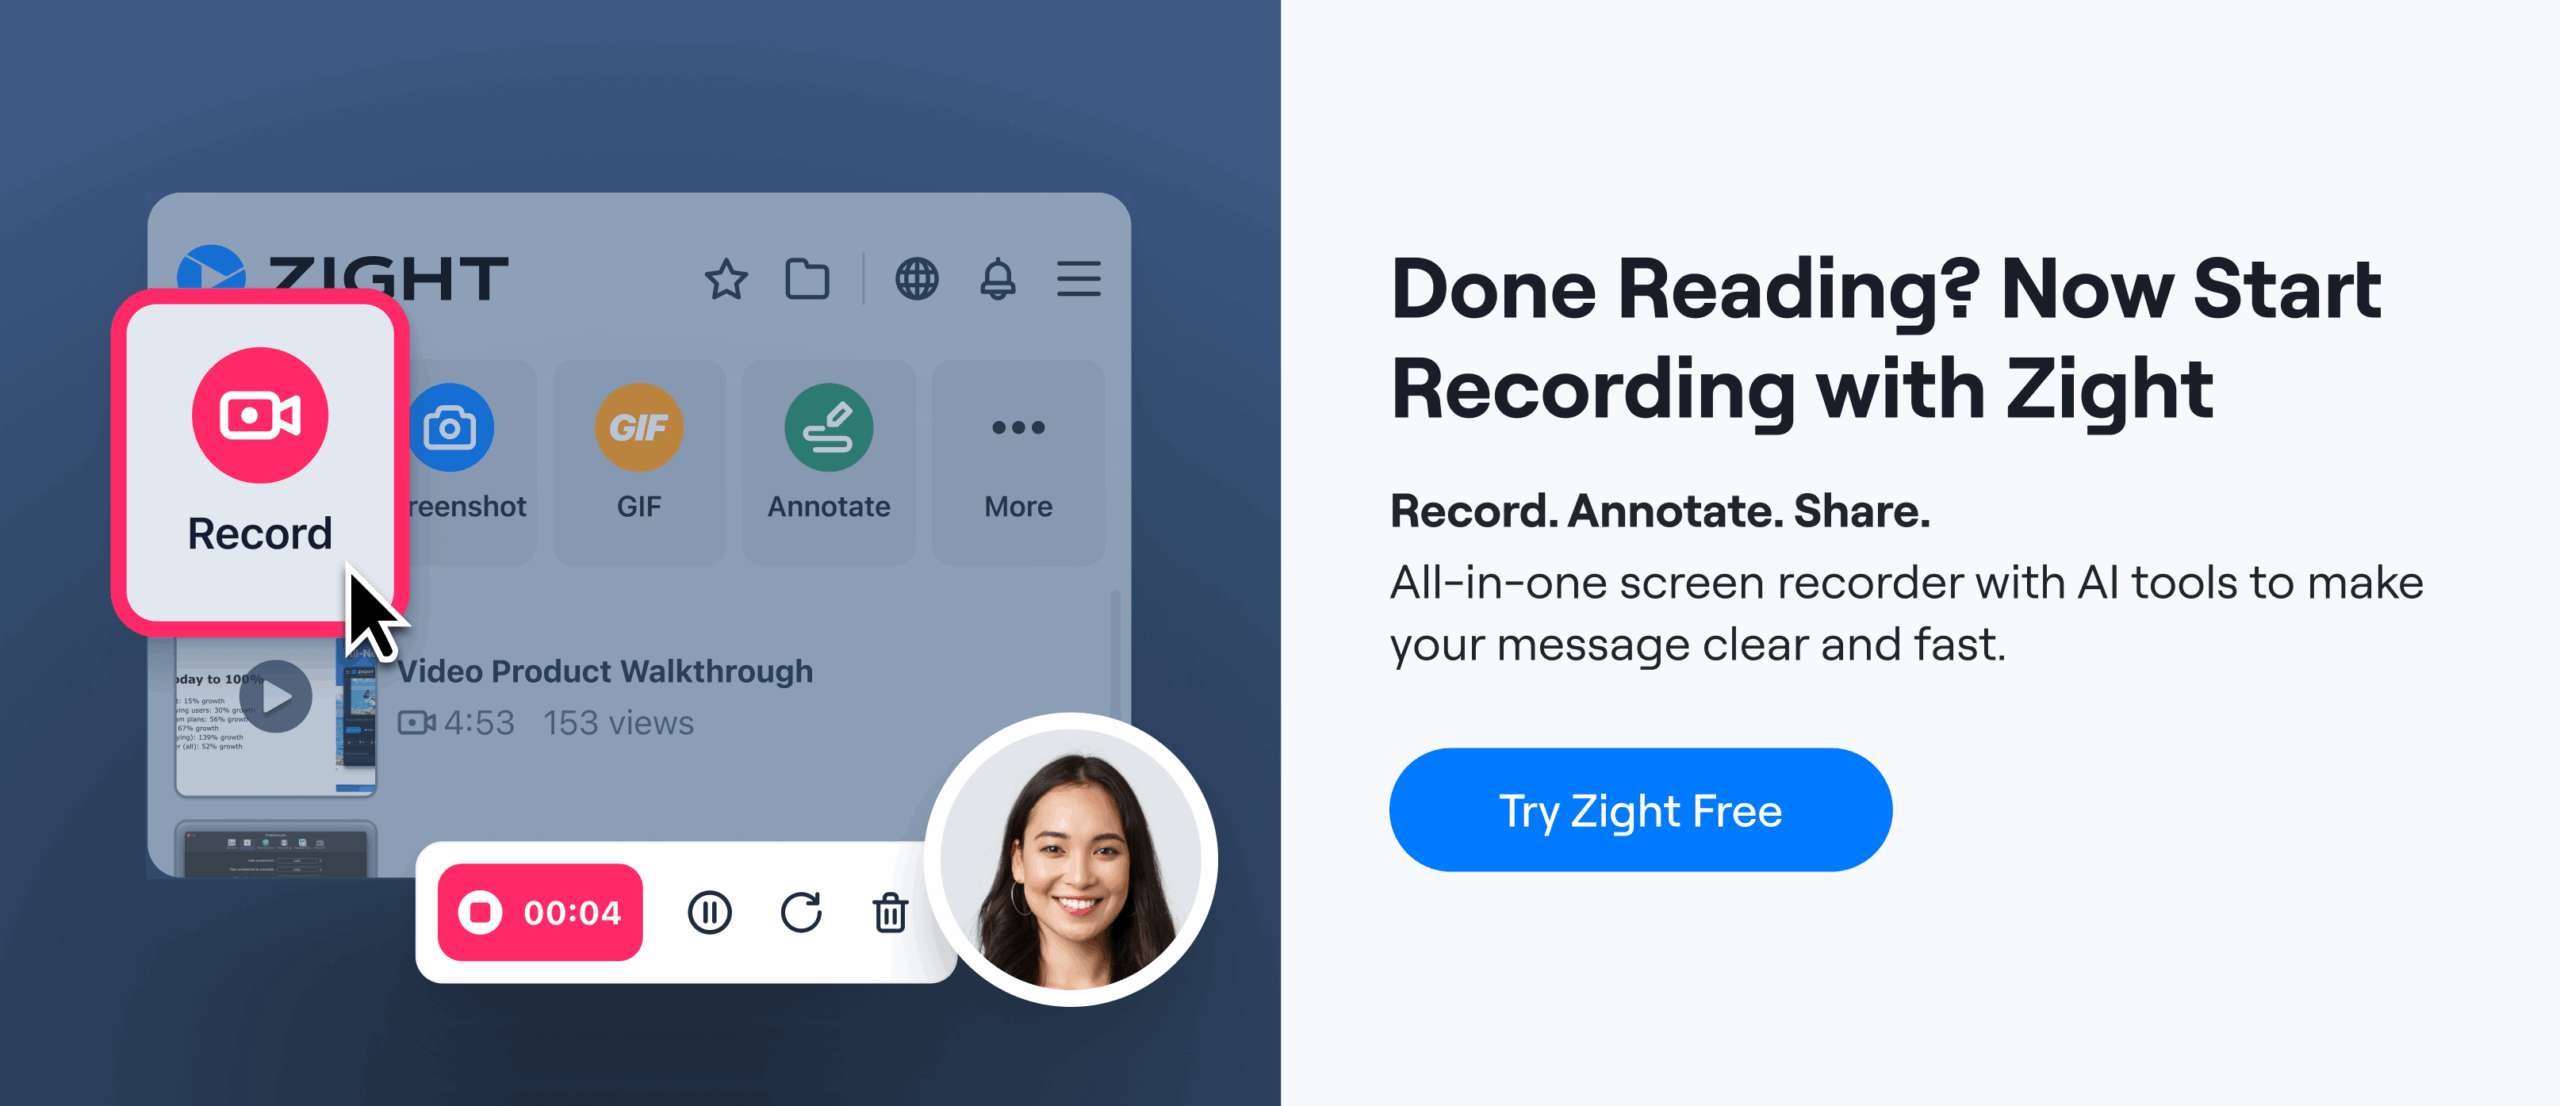
Ready to Boost Your Productivity?
Save time and money while boosting your productivity with Zight — free tools for screen recording, screenshots, GIFs, and webcam capture.
Try Zight for FreeHow to Use the HAR File Viewer
Follow these simple steps to get started.
Upload Your HAR File
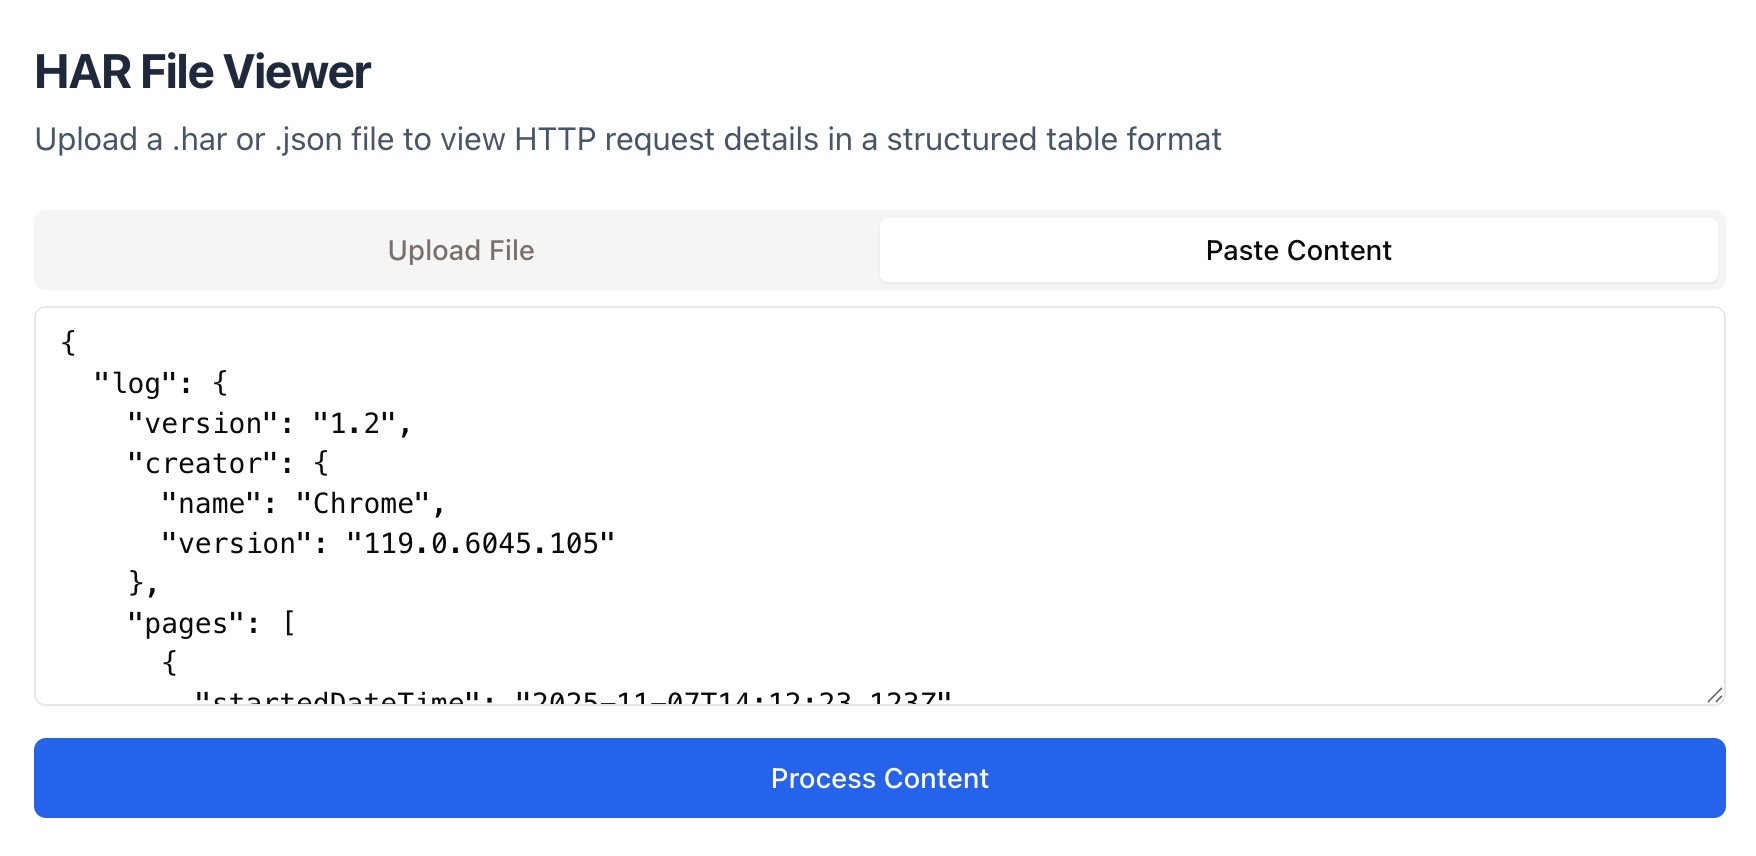
Upload a .har file directly from your device, or paste the file’s JSON content into the input field. HAR files can be exported from your browser’s developer tools (Network tab).
Automatic Parsing
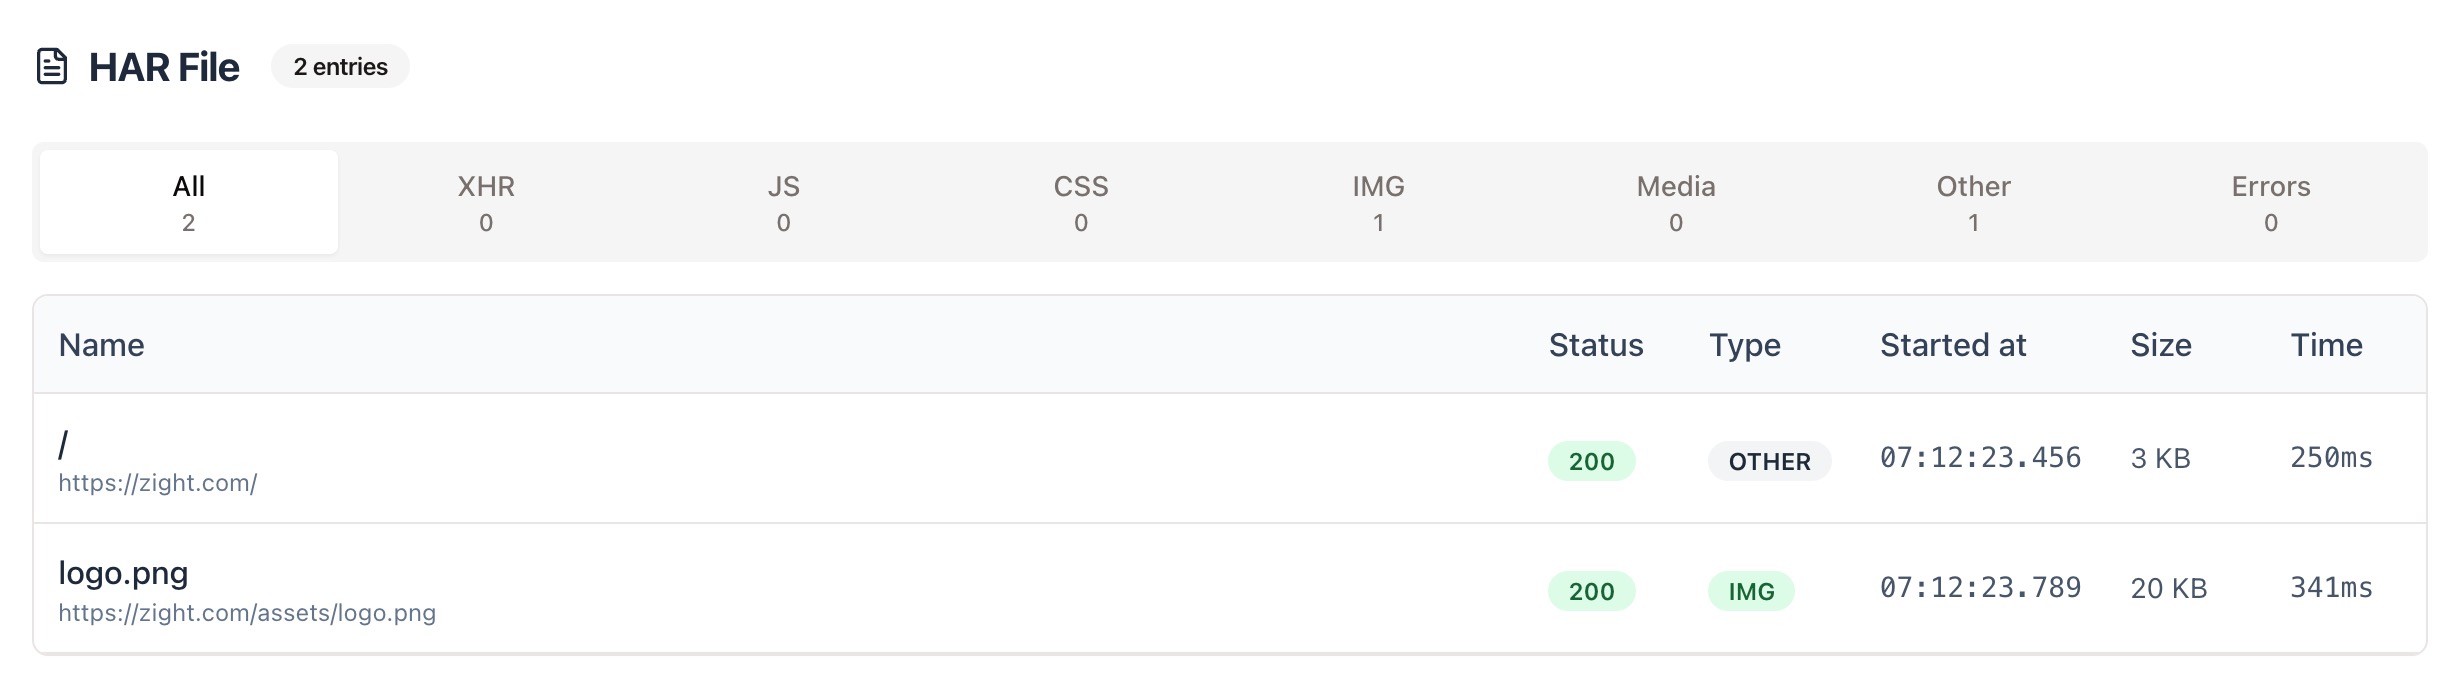
Once you upload, Zight automatically parses your HAR file and extracts all network entries, requests, and responses into a structured table.
View and Analyze Your Data
See each request’s status, type, timing, and size at a glance. You can filter by type (XHR, JS, CSS, IMG, etc.) and review performance metrics like load time and resource size.
Why Use a HAR Viewer
What is a HAR File
A HAR (HTTP Archive) file records all network requests and responses made by your browser while a page loads. It includes information like URLs, status codes, response times, and file sizes — making it a powerful tool for debugging APIs, slow loading pages, or failed requests.
Why Use a Viewer
Raw HAR files are structured as JSON and can be difficult to read. A viewer like Zight organizes the data into a clean table, helping you find what matters — whether it’s a failed request, a slow endpoint, or a missing resource.
Data Analysis and Optimization
Zight’s HAR File Viewer reads and visualizes key network metrics like request duration, size, and resource type. Each entry includes:
-
Request Details: Method, URL, and headers.
-
Response Details: Status code, content type, and size.
-
Timing Breakdown: DNS, SSL, wait, and receive times.
This makes it easy to identify bottlenecks, track caching behavior, or diagnose why a page may be loading slowly.

Supported Use Cases
For Developers
Debug API calls, response codes, and header data directly from HAR files.
For QA Engineers
Investigate failed requests, performance issues, or network bottlenecks during testing.
For Performance Analysts
Review load timing, waterfall charts, and caching behaviors to optimize site performance.
For Support Teams
Analyze customer-submitted HAR files to diagnose issues quickly.
Unlock More Tools
Expand your toolkit with these additional free tools
Ultimate Guide: How to View and Analyze HAR Files
Learn how to open and interpret HAR files using Zight’s free online viewer. Whether you’re troubleshooting a site issue or debugging an API, this guide will help you turn raw HAR data into actionable insights.
Upload Your HAR File
Start by exporting a HAR file from your browser. In Chrome or Edge, open Developer Tools, go to the Network tab, record your session, and click Save as HAR with Content. Then upload it or paste the file content directly into the text box.
View and Filter Requests
Once uploaded, Zight automatically parses and displays every network request in a structured table. You can sort by time, status, method, or resource type and expand each request to view headers, payloads, and response bodies.
Filtering by type — such as XHR, JS, CSS, or images — makes it easy to focus on the data that matters most to your investigation.

Analyze Performance Metrics
Zight highlights timing and size details for each request, including DNS lookup, SSL negotiation, and total response duration. Use these metrics to pinpoint delays, identify slow or large assets, and improve caching, compression, or backend performance.
Troubleshooting Common Issues
HAR files are invaluable for identifying network errors such as 404 Not Found, 500 Server Error, failed redirects, or CORS issues. By viewing request and response headers side by side, you can see exactly where things went wrong — without manually parsing JSON or switching between tools.
Conclusion
Zight’s HAR File Viewer helps you transform raw network data into clear, actionable insights. Upload your HAR file, view requests in a structured table, and quickly spot slow resources or failed requests — all without leaving your browser.
Whether you’re debugging an API, optimizing a website, or resolving customer issues, Zight makes network analysis simple, private, and fast.
Try Zight’s HAR File Viewer today and streamline your debugging process.
Frequently Asked Questions
A HAR (HTTP Archive) file records all network requests and responses from your browser as a webpage loads.
Open your browser’s Developer Tools, navigate to the Network tab, record activity, and choose “Save as HAR with content.”
Yes. You can paste HAR data directly into the text area, Zight will parse it automatically.
Yes. Each entry includes request methods, status codes, timing data, and response headers.
Yes. Use the tabs to focus on specific request types like XHR, CSS, JS, or images.
Zight supports large files, though extremely large HAR exports may take a few seconds to process.
Completely. Your HAR data is processed in your browser and never uploaded or stored.
Absolutely. It’s great for analyzing request timing, response codes, and backend performance.