Here at Zight (formerly CloudApp), we love hosting webinars to showcase tips and tricks in navigating the world of customer success and how our product fits into that equation.
Great customer experience hinges on your support and success team. Do users get a quick response when they have an issue? Do they get it resolved quickly? Do they feel valued with human interaction?
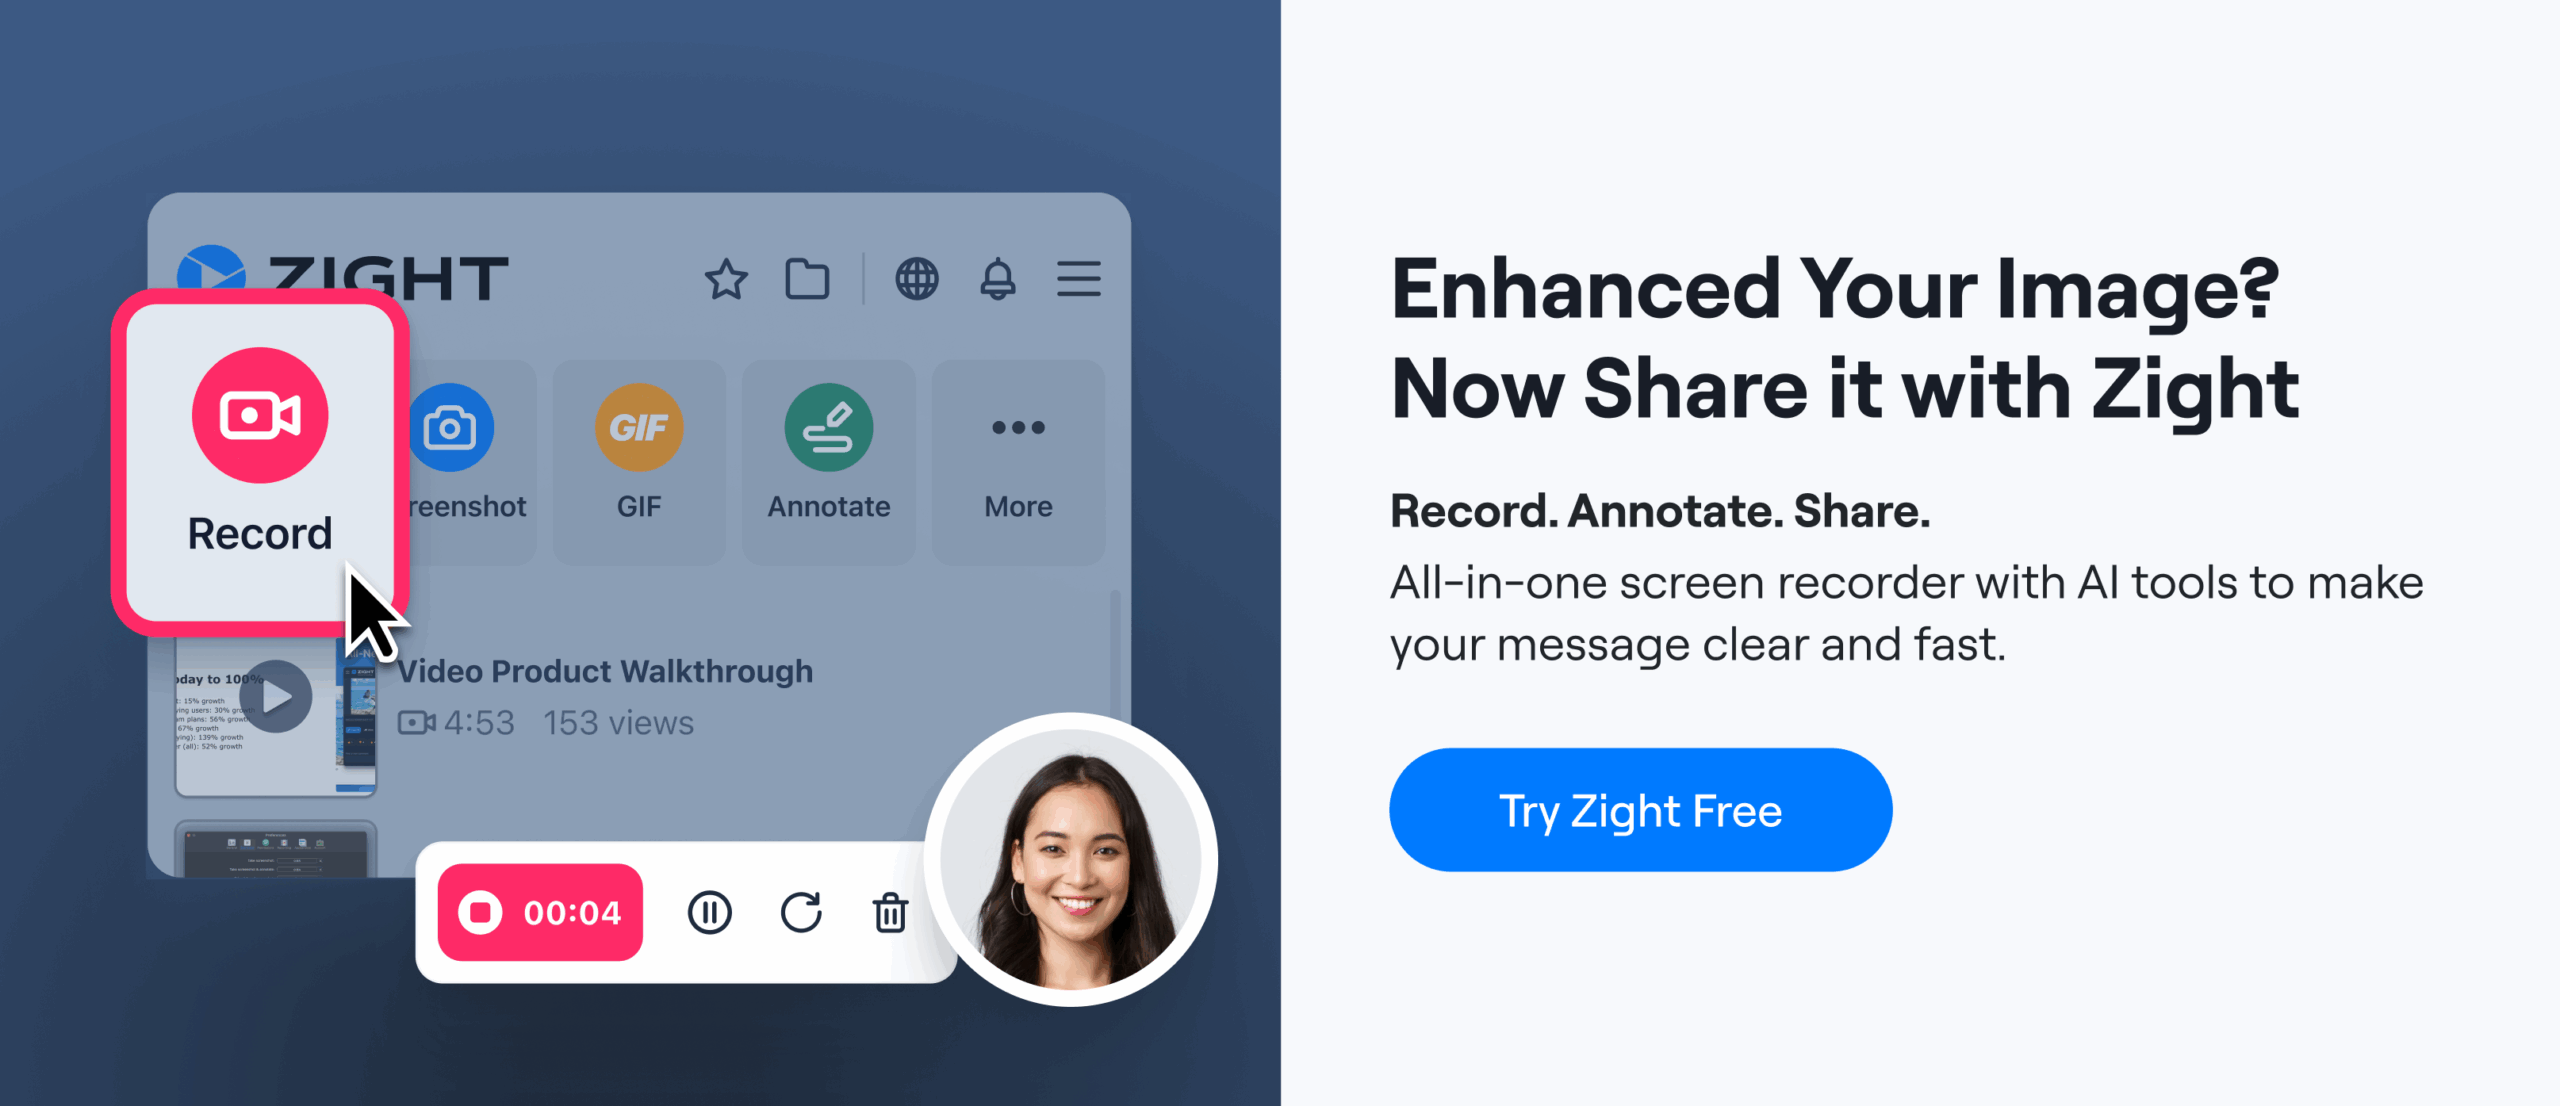
Whether it’s by using our screen recorder, gif creator, or screen capture annotator, we’re constantly seeing real-life use cases from our clients in how Zight (formerly CloudApp) is making their customer experience better each and every day.
In our most recent webinar, our very own Nico Chaparro, Customer Success Team Lead, talked about his experience at Zight (formerly CloudApp) and provided a template of how you can drive weekly happiness scores of 100, monthly scores of 80+, and decrease your response time by more than 50%.
Defining Customer Happiness
Nico began the webinar by defining “happiness score.”
While many of you are probably familiar with a CSAT (customer satisfaction) score which is the positive customer responses divided by the number of total responses, a happiness score takes into account negative responses, making it similar to NPS.
Happiness Score= Positive Responses – Negative Responses
___________________________________________
Total Responses
Zight (formerly CloudApp) has found the happiness score to be an accurate and more holistic view of what’s going on with our customer experience. Our CS team receives this data via a survey sent out after each support interaction, in which the customer is asked to rate the support they’ve received as “great,” “okay,” or “not good,” before having the opportunity to provide qualitative feedback.
Nico’s Experience
When Nico took over the Customer Success team at Zight (formerly CloudApp) last December, he noticed some less than ideal stats in regards to the average time it took support to get back to a customer and a decreasing overall happiness score.
At the end of each day there were a considerable amount of tickets left in the queue, which resulted in many customers waiting 3-5 days to receive support, an unacceptable response time in the fast-moving world of tech software.
When it comes to happiness scores, most companies shoot for a score between 70 and 80, at this time Nico mentioned (June 2020), our average happiness score was 56. Not great.
So why was this the case?
Through a deep dive, Nico was able to identify some key issues in our support team keeping our customer experience in a slump:
- No templated responses – when handling a high volume of tickets in support, these are a lifesaver and a key to maximum efficiency.
- No videos or GIFs – we weren’t utilizing our own product, resulting in lack of clarity and personability.
- Not building knowledge base – help center content not built out appropriately.
The Path to Improvement
The team was now on the same page about the necessity of improving our processes in order to provide our customers the experience they deserve. And the goalpost was reset to shoot for a happiness score of 100.
Here was the process of improvement:
- Create templated responses for FAQs: in support, it is likely that you will get the same type of questions over and over again. Before the customer success strategy revamp, our team was re-typing the same responses hundreds of times. Creating high quality templates to address common inquiries is a major key to maximizing efficiency, especially with a small team.
- Ensuring every templated response included a video or GIF: there was no better way to evangelize our own product and provide a more personalized customer experience than by including Zight (formerly CloudApp) screen recordings and/or GIFs in our responses. Having a rep walk a customer through a process with a step-by-step visual is often a much better support experience than by reading large amounts of text.
- Get the team used to showing their face (this was critical for our happiness score): this was a learning curve for some of our remote team members, but face-to-face contact really has the potential to change the entire dynamic of your customer success interactions and provide a more empathetic and effective customer experience.
- Add newly created visuals to our knowledge base: while there was a fair amount of text on our blogs and help articles, there was a lack of visual content to help walk our customers through their issues. Visuals are key to a strong support experience and high happiness score. In addition to creating brand new content, we also built videos and GIFs for all existing knowledge base articles.
- Every single response from our support reps now includes a video or GIF: in addition to the obvious personalization benefits I’ve already described, doubling down on your own product is always a good thing.
- Include extra how-tos at the end of tickets: Proactivity is a major key to customer success. Give your customers the tools to succeed.
- Set a goal of having an average first response time of less than 2 hours: Setting an aggressive goal (down from 3-5 days!) was a major motivator in our team’s success.
The Results
The first thing the team saw was that within only a couple weeks of implementing our new strategy, the average response time was down to 1 hour, with 98% of customers receiving a response within this time frame. A massive, massive improvement.
Another observation was that the team was now regularly meeting their goal of having zero tickets at the end of each day. Previously there were about 150 tickets remaining open at the end of each day. The team accomplished this with only 3 members working support and receiving an average of 50-60 tickets per day.
These changes have resulted in overall monthly averages of happiness scores over 80 with a considerable number of weeks having perfect scores of 100. Any score over 80 is considered world class in the world of customer support.
Nico is elated to now be seeing such consistent feedback from customers lauding his team’s speed, helpfulness, and kindness.
The webinar wrapped up in our usual fashion with Nico offering step-by-step instructions for how your customer success and support teams can more effectively be utilizing Zight (formerly CloudApp) videos and GIFs to increase your happiness scores and improve your customer experience.
You can watch this section starting here.
Final Thoughts/Q&A
As a thank you to our viewers, the webinar wrapped up with Nico providing a helpful template based off of insights and trends we’re seeing from some of the best customer support teams in the world.
This template is an easy place to view your support data and a report card highlighting scores and response times. It also includes instructions for how to use and data for you to compare your team to other high-performing support teams.
At the end of the day, customer support and success is all about making your customer happy and continuously showing them the value of your product.
We saw an overwhelmingly positive response from our attendees of this webinar. The tips and tricks shared by Nico in this webinar truly revolutionized the support experience at Zight (formerly CloudApp) and we’re confident any support team that implements our best practices will receive similar results.
Check out the full recording by accessing our Youtube channel as well as feel free to access our complimentary customer support template here.