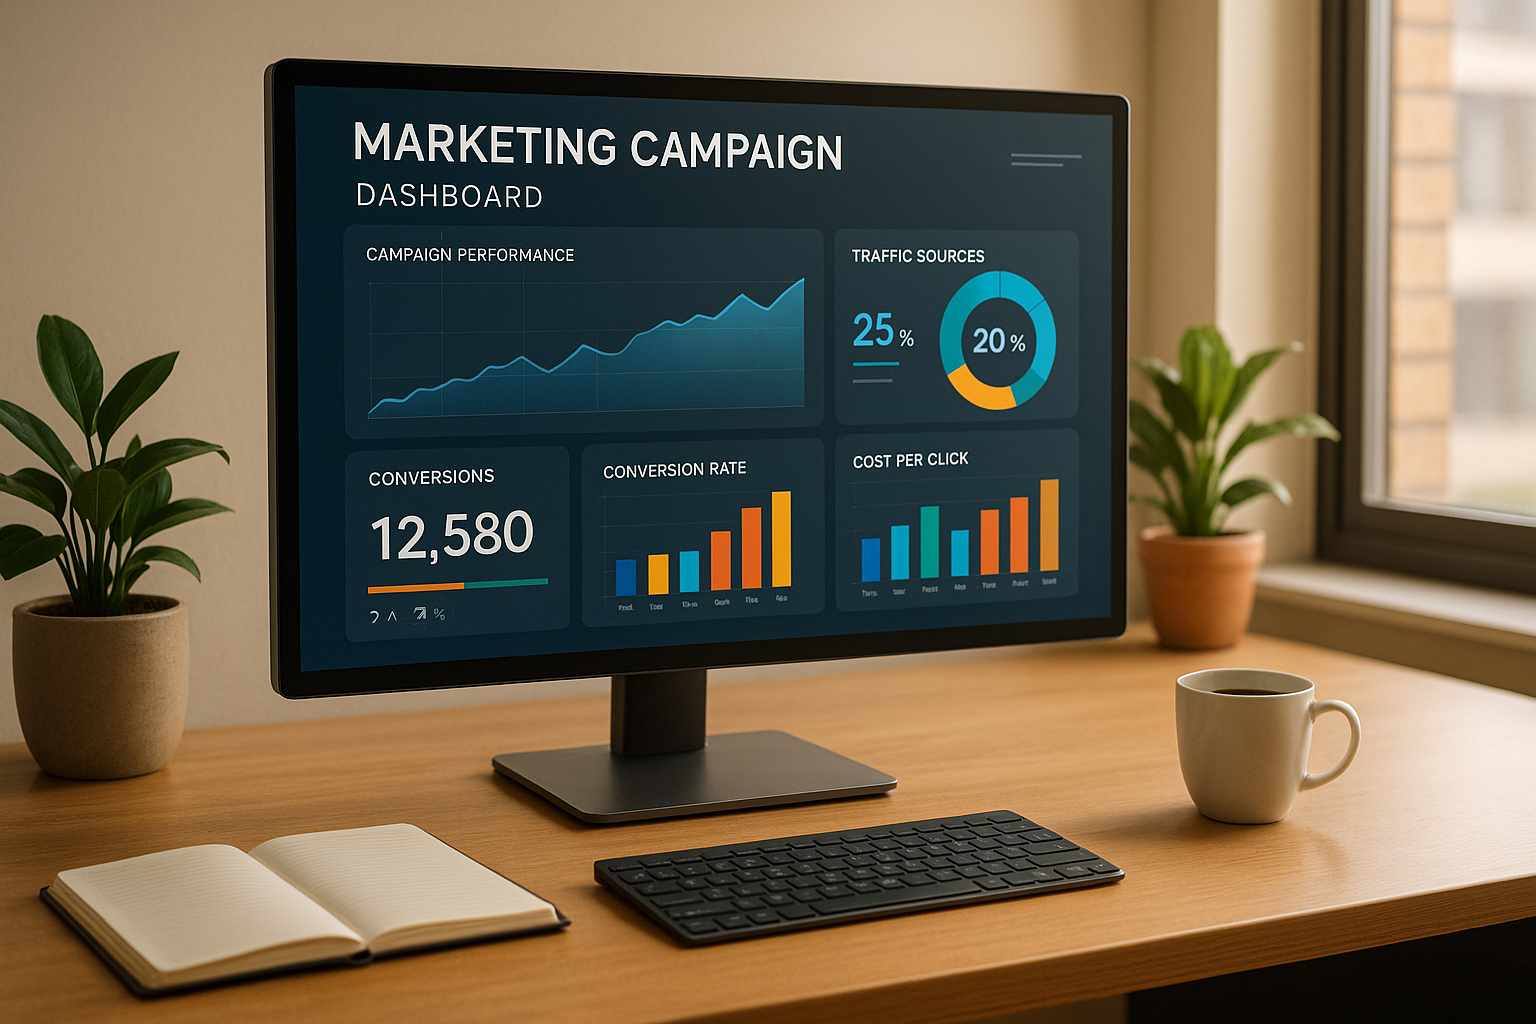
- What They Are: Real-time dashboards pull live data from platforms like Google Ads, Facebook, and email tools, showing metrics like click-through rates, conversion rates, and ROI, all in one place.
- Why They Matter: They help you act quickly, pause underperforming ads, shift budgets, or scale up winning campaigns. Teams also stay aligned with shared, up-to-date insights.
- Key Features: Live data feeds, customizable visuals, alert systems, and collaboration tools (like Zight for sharing insights).
- How to Build One: Define goals, connect data sources via APIs or webhooks, and design a clear, actionable layout. Use tools like ETL services for clean data and platforms for visualization.
Tools for Building Real-Time Campaign Dashboards
Creating effective dashboards requires the right tools, covering everything from data collection to visualization. Each tool plays a unique role, helping gather, process, and present data in ways that lead to actionable insights. Let’s look at how integration tools, dynamic visuals, and collaborative platforms like Zight all work together to generate real-time insights.Data Collection and Integration Tools
At the heart of any real-time dashboard is its ability to pull data from multiple sources quickly and accurately. APIs and webhooks are key players here, ensuring data flows seamlessly and updates in real time. Many advertising platforms provide APIs that continuously feed performance metrics, while email marketing tools like Mailchimp and Constant Contact offer APIs to track opens, clicks, and conversions as they happen. Webhooks take things a step further by pushing data instantly when events occur. For example, the moment someone completes a purchase or submits a form, that data appears in your dashboard without delay. This immediacy can make a huge difference when monitoring time-sensitive campaigns. ETL (Extract, Transform, Load) tools are essential for processing data. They clean and standardize information coming from different platforms, ensuring your metrics are consistent and easy to interpret, no matter the source. For campaigns generating large amounts of data, database streaming services like Amazon Kinesis and Google Cloud Pub/Sub are indispensable. These tools handle high data volumes in real time, keeping your dashboard responsive even during heavy traffic spikes.Visualization and Dashboard Platforms
The real magic of dashboards happens when raw data is transformed into clear, actionable visuals. Many dashboard platforms offer user-friendly drag-and-drop interfaces, making it easy to create custom views without needing advanced technical skills. For instance, you can build comparison charts to track weekly performance or funnel visualizations to follow users from their first ad click to the final conversion. Interactive features take dashboards to the next level. Clickable charts let you dive deeper into metrics, while filters allow team members to focus on the data most relevant to their roles. Mobile-friendly designs ensure you can access insights on the go, whether on a smartphone or tablet. Automated refresh options keep your visuals up-to-date, with refresh rates tailored to your specific data needs, helping you make quick adjustments when necessary.Collaboration and Sharing Tools (Featuring Zight)
Dashboards become even more impactful when teams can collaborate effectively around the insights they provide. Once data is visualized, collaborative tools make it easier for teams to discuss and act on these findings. Screen recording tools, for example, simplify the process of sharing insights. Zight excels in this area by enabling teams to instantly capture and share key metrics. With Zight, you can record brief screen videos to explain trends or highlight concerning metrics, then share them directly with your team. During dashboard reviews, Zight’s annotation tools let you mark up screenshots, add arrows, and include callouts to emphasize important points. You can even create step-by-step visual guides to onboard new team members or clarify complex data.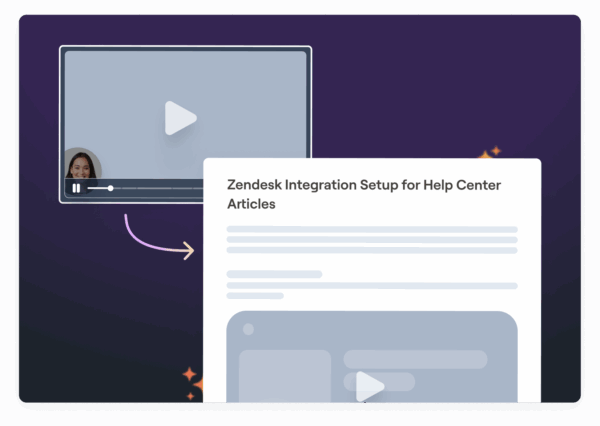 Zight’s integrations with platforms like Slack and Microsoft Teams ensure seamless communication. For example, when you record a screen explanation of campaign performance, it can be shared directly in your team’s preferred messaging channel. Additionally, Zight’s AI-powered transcription and summary features make collaboration even easier. Screen recordings can be transcribed automatically, allowing team members to quickly search and reference key insights.
 Step-by-Step Guide to Building a Real-Time Dashboard
Creating a real-time dashboard involves defining the right metrics, connecting data sources, and designing a layout that’s both functional and visually appealing. With the proper tools in place, you can build a dashboard that supports fast, data-driven decisions for your campaigns.Step 1: Identify Campaign Goals and Metrics
Start by clarifying your campaign’s objectives to determine the most relevant metrics. For example:- Lead generation campaigns often track cost per lead and conversion rates.
- Brand awareness campaigns focus on metrics like reach and engagement rates.
- E-commerce campaigns prioritize return on ad spend (ROAS) and conversion value.
Step 2: Connect Data Sources
Gather data from all relevant platforms using tools like APIs, webhooks, and secure authentication protocols. For secure and reliable data flows, use service accounts and OAuth 2.0 authentication. To avoid confusion, standardize metric names across platforms. Before going live, test your connections thoroughly. Run parallel tracking and compare the dashboard’s metrics with native platform reports to confirm accuracy. Once your data is flowing seamlessly, you can shift your focus to creating a layout that turns raw data into actionable insights.Step 3: Design and Customize the Dashboard Layout
A well-designed layout ensures your dashboard is easy to use and understand. Organize information with a clear visual hierarchy, place the most important metrics front and center. Use consistent color coding to make interpretation faster: green for positive performance, red for issues, and neutral tones for areas needing attention. Choose the right visualizations for your data, such as:- Line charts for trends over time
- Bar charts for comparing metrics
- Gauge charts for KPI snapshots
Customizing Dashboards for Your Campaign Needs
Once your dashboard’s structure is in place, the next step is tailoring it to meet the unique demands of your campaigns and team workflows. Customization helps you make faster, more informed decisions by refining how data is displayed and interpreted.Customizing Visuals and Widgets
Choosing the right visuals can make a big difference in how effectively your data tells its story. For quick overviews, sparklines work well as trend indicators in executive summaries, while detailed line charts are better for digging into performance changes over specific time periods. These choices should complement the initial layout decisions you’ve already made. Establish a consistent color scheme to simplify interpretation: green for positive trends, red for negative outcomes, and amber for areas needing attention. This kind of visual shorthand allows team members to quickly assess campaign health without diving into every data point. Tailor widgets to the needs of specific roles. For example:- Performance marketers might need widgets showing cost per acquisition alongside lifetime value.
- E-commerce teams could benefit from pairing revenue metrics with inventory levels.
Improving Team Collaboration with Tools Like Zight
Collaboration tools like Zight can enhance how your team shares and discusses dashboard insights. Use Zight to create short walkthrough videos and annotate key data points. Sharing these videos through platforms like Slack or Microsoft Teams ensures everyone, including remote team members, stays aligned. Zight’s integrations make it easy to incorporate dashboard insights into daily standups or campaign reviews. Quick video summaries allow stakeholders to review updates on their own schedules, while AI transcription features create searchable records of discussions. These records make it simpler to track decisions and revisit key moments when needed.Regular Review and Dashboard Improvements
To keep your dashboard effective, schedule regular updates and reviews based on the metrics and decisions it supports.- Real-time or hourly updates are ideal for high-stakes events where immediate changes need to be captured.
- Daily reviews help maintain operational accuracy during normal campaign activity.
- Weekly reviews provide a deeper look at performance trends.
- Monthly reviews work for tracking long-term, strategic metrics.
Reading Real-Time Data and Taking Action
The real strength of a dashboard lies in its ability to turn data into actionable insights that can improve campaigns immediately. Real-time data analysis demands a mindset focused on seizing opportunities and tackling issues as they surface.Understanding Key Metrics and Trends
Once your dashboard is up and running, the next step is making sense of the live data it provides. Pay close attention to metrics like CTR, conversion rates, and CPA. They offer valuable insights into campaign performance and audience behavior.- Click-through rate (CTR) reflects audience engagement. A sudden drop could signal changes in competitor activity or shifts in audience interest, both of which need immediate investigation.
- Conversion rates reveal whether the traffic you’re driving is resulting in meaningful actions. A sharp decline in this metric, despite stable traffic, might point to a mismatch between your ad messaging and the landing page experience.
- Cost per acquisition (CPA) is crucial for monitoring your spending in real time. A sudden spike could mean you’re attracting higher-quality traffic, or it might expose inefficiencies in your targeting. Comparing CPA with long-term metrics like customer lifetime value can help refine your spending strategy.
Using Graphs and Tables for Data Analysis
Visual tools like graphs and tables are invaluable for interpreting data quickly and effectively:- Time series graphs help you track performance trends over specific periods. They’re particularly useful for identifying whether metric changes are gradual or abrupt.
- Heatmaps show how users interact with your landing pages, highlighting where they click, how far they scroll, and which elements grab their attention. These insights can pinpoint areas where conversions may be falling short.
- Funnel visualizations break down the conversion process step by step, making it easy to see where potential customers drop off. This allows you to focus your efforts on the stages that need the most attention.
- Comparison tables let you evaluate multiple campaign variations side by side. By comparing key metrics across different ad sets or creatives, you can quickly identify what’s working and allocate resources accordingly.
- Geographic performance maps highlight regional trends that might not be obvious from other data. Real-time insights into geographic performance can help you adjust targeting or budgets to capitalize on unexpected opportunities.
Making Data-Driven Campaign Adjustments
Real-time data empowers you to make swift, informed changes to your campaigns. For instance, you can reallocate budgets to high-performing campaigns as soon as the data shows clear advantages.- Adjust audience targeting when behavioral data reveals unexpected engagement from new segments. Expanding your focus to include similar demographics can open up fresh opportunities, while underperforming segments might need reduced budgets or even a pause.
- Optimize creative elements by running quick A/B tests. If engagement starts to dip, having alternative creatives ready to deploy can help you recover quickly.
- Modify bid strategies to respond to market changes. For example, if competition drives up costs during certain times, shifting your bidding strategy or reallocating budgets to less competitive periods can save money.
- Update landing pages based on user behavior. If visitors consistently drop off at a particular point, small adjustments, like repositioning a call-to-action or simplifying a form, can boost conversion rates.
Conclusion: Building Effective Dashboards for Campaign Success
Creating a real-time dashboard turns raw data into actionable insights, empowering you to make quick, informed decisions at every stage of your campaigns. Start by defining key metrics like CTR, conversion rates, and CPA to shape your dashboard’s structure. From setting clear goals to making rapid adjustments, an effective dashboard requires thoughtful planning, the right tools, and consistent updates. The tools you choose and how you integrate them will determine whether your dashboard becomes a powerful decision-making resource or just another screen to glance at. The most effective dashboards are those that your entire team can easily understand and use to drive action. Customize visuals, widgets, and layouts to align with your team’s workflow so that crucial information is instantly accessible when decisions need to be made. Platforms like Zight can be game-changers here, helping teams share insights, create step-by-step guides for dashboard usage, and maintain clear communication about performance shifts. The real value of a dashboard shines during the action phase. Real-time data is only useful if you can interpret trends, identify anomalies, and make immediate adjustments. Effective managers rely on dashboards to track performance and fine-tune strategies on the fly. Regular reviews and team input ensure your dashboard remains relevant and keeps delivering meaningful insights. As discussed, refining your dashboard is essential for turning real-time data into tangible campaign results. In today’s fast-moving digital marketing world, the ability to understand and act on campaign data in real time can be the defining factor between success and missed opportunities.FAQs
What are the best practices for combining data from multiple sources into a real-time campaign dashboard?
To bring data from various sources into a real-time campaign dashboard effectively, the first step is to clearly define your business goals and identify the data you need. This helps you zero in on the metrics that truly matter. Tools like ETL (Extract, Transform, Load) processes or APIs can simplify data integration, while standardizing data formats ensures consistency across all sources. Wherever possible, automate workflows to cut down on manual tasks and keep the data flowing in real time. It’s also crucial to regularly test and fine-tune the integration process to catch any issues and boost performance. A clean, focused dashboard design makes it easier to understand the data and take swift action.
How can I make sure my real-time campaign dashboard shows accurate and up-to-date metrics?
To keep your real-time campaign dashboard accurate and current, start by applying real-time data validation as data is collected. This helps ensure the information is reliable from the start. Incorporating tools with automatic data normalization can also streamline inputs and cut down on potential errors. Using cloud-based processing is another smart move, especially for managing large volumes of data. It speeds up processing and reduces delays, ensuring your dashboard stays updated with the latest metrics. Finally, take time to regularly evaluate your dashboard’s goals and adjust your analytics tools to highlight the most relevant metrics. This way, your data stays precise and remains useful for decision-making.
How can I customize my dashboard visuals to meet my marketing team’s unique needs?
To design dashboard visuals that resonate with your marketing team, focus on crafting displays that are clear, engaging, and actionable. Tools like Zight can be a game-changer for this. With Zight, you can easily capture and annotate screenshots, helping you highlight key data points or address questions efficiently. Plus, it offers video editing features like trimming unnecessary parts, adding text or arrows for clarity, and applying effects like blurring to keep your content polished and professional. By tailoring visuals to spotlight the most relevant metrics and insights, you can keep your team aligned and well-informed throughout your marketing campaigns.