Understanding how people interact with asynchronous videos is key to making your content more engaging and effective. Asynchronous videos, pre-recorded and available on-demand, give viewers the freedom to watch at their own pace, making them ideal for training, onboarding, or tutorials. To improve these videos, focus on analyzing viewer behavior through metrics like retention rates, engagement patterns, and device usage.
Key Insights:
- Retention Metrics: Track where viewers drop off or rewatch to identify strong and weak sections.
- Engagement Data: Monitor pauses, replays, and click-throughs on CTAs to gauge interest and usability.
- Device and Platform Trends: Understand how audience preferences vary between mobile and desktop to optimize content delivery.
- Actionable Analytics: Use tools like Zight to collect and interpret data, enabling better decisions on video length, structure, and focus.
By leveraging these insights, you can refine your content strategy to better meet audience needs and boost overall video performance.
Setting Up and Accessing Analytics in Zight

Getting started with Zight’s analytics tools is simple, and understanding where to find the right data ensures you’re making the most of your efforts. The platform offers varying levels of analytics based on your subscription plan, so it’s important to know what’s available to you. Here’s how to enable analytics and make sense of the data Zight collects.
Enabling Analytics in Zight
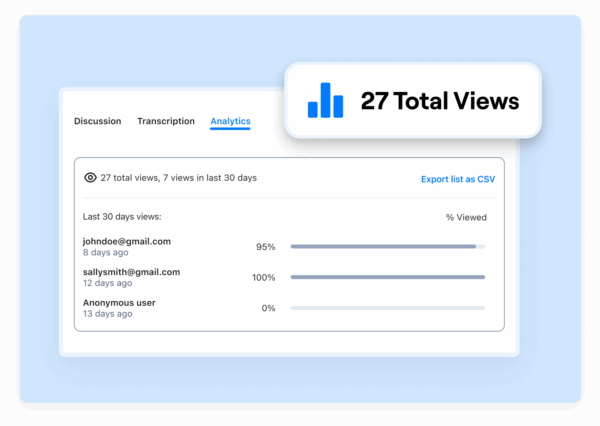
Zight’s analytics kick in automatically when you share videos. Even on the free plan, you’ll have access to basic metrics like view counts and notifications, giving you a snapshot of your content’s reach.
If you’re using Pro, Team, or Enterprise plans, you’ll unlock more detailed insights. These include metrics like viewer identity, percentage of the video watched, completion rates, and call-to-action engagement. Enterprise users get additional perks, such as exporting viewer email addresses and timestamps for deeper analysis.

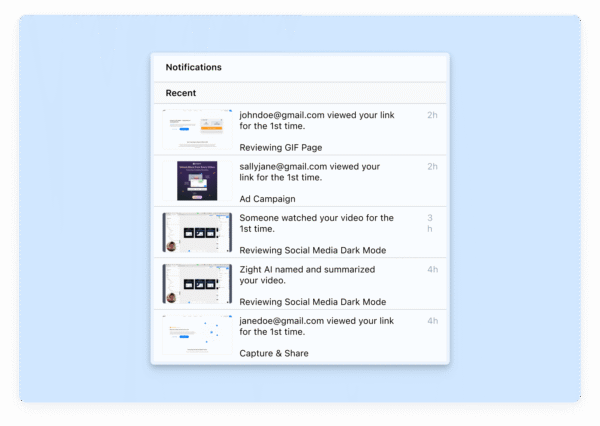
You can access analytics either through the Zight app or the web dashboard. The app provides a quick way to check view counts. Just locate your uploaded video, and the view count is displayed on the right-hand side. For more in-depth data, log into the web dashboard at zight.com, click the application icon, and select the globe icon in the upper-right corner.
Now, let’s dive into the specific data Zight tracks.
Understanding the Data Zight Collects
Zight collects a variety of data points to help you understand how viewers interact with your content. At the basic level, it tracks view counts and timestamps, giving you a sense of when your audience is most engaged.
For deeper insights, Zight provides metrics like the percentage of the video viewed. This shows how much of your video viewers watched before clicking away, helping you identify which parts of your content keep their attention and which might need tweaking.
Completion rates are another key metric, showing the percentage of viewers who watched your video all the way through. Paired with drop-off data, this can help you determine the ideal video length and pinpoint sections that may need improvement.
If viewers are logged into their Zight accounts, their email addresses will appear in the analytics, allowing you to track specific engagement. For anonymous viewers, the platform still captures general engagement patterns, giving you a mix of broad and detailed data.
For videos with embedded calls-to-action, Zight tracks conversion rates. how many viewers clicked through or completed the desired action. This data ties directly to your business goals, showing how effectively your videos drive results.
Connecting Zight with Other Platforms
Zight’s integrations take analytics to the next level, seamlessly incorporating video insights into your existing workflows. To set up an integration, go to your Zight settings, find the “Integrations” tab, select the platform you want to connect, and follow the prompts for authorization.
Slack integration is particularly handy for teams sharing training videos or product updates. Once connected, analytics notifications can be sent directly to relevant Slack channels, keeping everyone informed without leaving their primary communication tool.
Microsoft Teams works similarly, allowing you to share analytics reports and receive updates in your team’s collaboration space. This is especially useful for businesses using asynchronous videos for onboarding or training.
Jira integration links your video analytics to project management workflows. For example, if you’re creating instructional videos for software features or bug fixes, you can connect performance data directly to related tickets or projects.
Keep in mind that admin permissions are required for all integrations. You’ll need admin or owner-level access to authorize these connections, so it’s a good idea to coordinate with your IT team or platform administrators before getting started.
These integrations turn analytics into actionable insights, helping you identify trends, share data with stakeholders, and refine your video strategy for better results.
Key Metrics for Analyzing Viewer Behavior
Once you’ve set up Zight analytics, it’s time to dive into the metrics that can help you fine-tune your asynchronous video strategy.
Retention Metrics
Retention metrics like average watch time and completion rates are essential for understanding how well your videos hold attention. For instance, if your 5-minute video averages just 2 minutes of watch time, it’s a clear sign that viewers are losing interest halfway through.
Completion rates, on the other hand, measure how many viewers watch your video from start to finish. If fewer than 50% of viewers stick around until the end, your content might be too long, poorly structured, or failing to deliver value quickly. Videos with completion rates above 70% often align well with what viewers want and expect.
Another critical retention metric is drop-off points. These pinpoint exactly where viewers stop watching. Zight’s analytics can highlight moments where interest wanes, which often happens when videos lack focus, include irrelevant details, or fail to transition smoothly. By identifying these moments, you can make targeted improvements to your content.
Retention metrics also vary depending on the type of video. For instance, training videos might naturally have different engagement patterns compared to product demos or team updates. Comparing metrics across these formats helps you set realistic benchmarks and refine your approach.
Next, let’s explore how viewers interact with your content through engagement metrics.
Engagement Metrics
Engagement metrics go beyond watch time to show how actively viewers interact with your videos. Zight provides insights into several key behaviors that reveal deeper viewer engagement.
Replay behavior is a strong indicator of interest. When viewers rewatch specific sections, it could mean they found the content particularly valuable or, conversely, that something was unclear. High replay rates in certain areas can guide you to create follow-up content or break down complex topics into shorter, more digestible videos.
Click-through rates on embedded calls-to-action (CTAs) measure how well your videos drive specific actions. Whether it’s directing viewers to additional resources, gathering feedback, or encouraging next steps, these metrics show how effective your content is at prompting action.
Pause patterns provide another layer of insight. Frequent pauses might suggest viewers are taking notes or processing detailed information. Recognizing these patterns can help you adjust the pacing of your videos or add natural breaks for better comprehension.
Interaction timing highlights the moments when viewers are most engaged. Strong early engagement often reflects an effective opening, while sustained interaction throughout the video signals consistent value. If engagement drops off early, it could point to a weak introduction or unclear messaging.
These engagement metrics provide a foundation for understanding how devices and platforms influence viewer behavior.
Device and Platform Data
Knowing what devices your audience uses can help you optimize both delivery and accessibility. With mobile devices now accounting for 63% of all web traffic compared to 36% for desktops, this data is critical.
Mobile vs. desktop viewing habits reveal key differences in content preferences. Mobile users tend to favor shorter, more concise videos that are easy to watch on smaller screens, while desktop viewers might prefer longer, more detailed content that benefits from larger displays and better audio quality.
Operating system and browser data can uncover technical issues. For example, if many viewers use older browsers or specific mobile platforms, you’ll want to ensure your videos load quickly and display correctly across these environments.
Geographic and time-based viewing patterns add context to when and where your videos are being watched. Asynchronous videos often get viewed outside regular work hours, so understanding these trends can help you schedule content more effectively.
Connection speed also plays a role in the viewing experience. Users with slower internet connections may abandon videos that take too long to load, while those with faster speeds can handle higher-quality video files. Zight’s analytics can help you strike the right balance between quality and accessibility, ensuring your content reaches as many viewers as possible without compromising the experience.
Here’s a compelling stat: improving mobile load times by just 100 milliseconds can boost conversion rates by 7% and reduce abandonment. This underscores the importance of leveraging device and platform data to shape your video strategy effectively.
Using Analytics to Improve Asynchronous Video Content
Analytics offer a treasure trove of insights that can help refine your video content. By diving into detailed metrics, you can identify specific areas for improvement and create more engaging videos. Retention metrics, in particular, are invaluable for turning raw data into actionable strategies.
Start by analyzing visual data to uncover the moments that captivate your audience and those that may cause them to lose interest.
Finding Trends and Patterns
Once you’ve established key metrics, it’s time to dig deeper into retention graphs. These graphs, like the audience retention tool in Zight’s analytics, provide a clear picture of where viewers are engaged and where they drop off. By carefully reviewing these insights, you can identify high-performing segments that resonate with viewers and pinpoint areas that need adjustments.
This method allows you to make targeted improvements, ultimately boosting viewer engagement and ensuring your content hits the mark.
Advanced Analytics and Reporting in Zight
Once you’ve got the basics of analytics down, Zight’s advanced features take things to the next level. These tools transform raw data into meaningful insights, helping you refine your approach to asynchronous video content. They also make it easy to export and share reports, giving your team broader access to these valuable insights.
Exporting and Sharing Analytics Reports
Zight’s reporting options vary depending on your plan, ensuring flexibility for all types of organizations. The Pro, Teams, and Enterprise plans include detailed analytics insights that help you measure your content’s impact and build performance reports.
For a deeper dive into the data, the Enterprise plan offers advanced reporting features. Enterprise users can export viewer emails and timestamps, delivering granular insights that are especially useful for tracking specific stakeholder engagement or proving ROI to leadership teams.
The export feature is a game-changer for collaboration. It lets you pull data straight from Zight’s analytics dashboard and share it with team members who might not have direct access to the platform. Whether you’re preparing for quarterly reviews, conducting audits, or creating custom dashboards, these reports provide the foundation for strategic analysis and smarter content delivery.
Real-Time vs. Historical Data
Knowing when to use real-time data versus historical data can make a big difference in your content strategy. Real-time data gives you immediate insights, updating constantly to reflect current metrics and events as they happen. This is perfect for situations where quick decisions and fast reactions are necessary, like monitoring live campaigns or responding to viewer behavior on the fly.
On the other hand, historical data offers a broader perspective. It helps you identify long-term trends, spot patterns, and assess outcomes over time. While it doesn’t update as quickly as real-time data, it’s invaluable for long-term planning and predicting future performance.
The key is to use both. Real-time data is ideal for immediate actions, like testing new content formats or responding to feedback. Historical data shines when you’re planning content calendars, analyzing seasonal trends, or making decisions about where to allocate resources. Together, they provide a balanced approach that not only optimizes current performance but also prepares you for the future.
Combining Analytics with Other Tools
To get the most out of your video analytics, it’s smart to integrate Zight with other business tools. This allows you to connect video engagement metrics with broader organizational data, offering a more complete picture of your content’s performance.
For instance, syncing Zight with your CRM system can show how your videos influence lead progression through the sales funnel. Similarly, integrating with project management tools can help you link content performance to production timelines and resource allocation.
When analytics are part of a larger ecosystem, they stop being isolated metrics and become valuable business insights. This integration helps you see how your videos contribute to bigger goals, like improving employee training, streamlining customer onboarding, or enhancing overall content delivery. By establishing clear data flows between Zight and your existing tools, you ensure that video analytics play a meaningful role in decision-making across your organization. This not only leads to more sophisticated analysis but also strengthens the case for continued investment in asynchronous video content.
Conclusion: Getting the Most from Asynchronous Video Analytics
Analytics offer a window into viewer behavior, helping you refine your content for better engagement and retention. By understanding how your audience interacts with asynchronous videos, you can fine-tune your approach to boost performance. Here’s a recap of the main points and actionable steps to turn insights into results.
Key Takeaways
Focus on the metrics that matter most. Retention rates highlight where viewers drop off, while engagement metrics show which parts of your content resonate. Device and platform data are also crucial, they let you ensure your videos look and perform well across different screens and environments. These insights are the foundation of a data-informed strategy.
Make analytics a regular habit. Instead of occasional deep dives, consistent reviews can help you identify trends early. This allows you to build on what’s working and address issues before they become bigger problems. The best video creators treat analytics as an ongoing dialogue with their audience, not a one-time task.
Act on what the data tells you. For instance, if viewers consistently drop off at a specific point, it might signal a need to restructure your content. Or, if mobile users engage differently than desktop viewers, you can adjust your approach to suit each platform. The key is to turn insights into action.
Next Steps
Ready to put these insights into practice? Start by enabling analytics in your Zight account. If you’re using the Pro, Teams, or Enterprise plans, you already have access to analytics tools that can enhance your video strategy. Begin by tracking retention rates, monitoring engagement trends, and reviewing the devices your audience uses most.
Create a simple, consistent review schedule. Spending just 15 minutes a week analyzing your top-performing videos can reveal patterns that guide your content decisions. Look for what’s working well so you can replicate it, and identify areas where viewers lose interest to make improvements.
If your needs are more advanced, consider upgrading to Zight’s Enterprise plan. The additional reporting features are especially helpful for tracking specific audience groups or preparing detailed performance reports for leadership.
Finally, experiment with A/B testing. Use your analytics to test different formats and approaches. Don’t be afraid to make bold changes when the data supports them, your audience is already showing you what they prefer through their viewing habits. Analytics simply help you listen and respond more effectively.
FAQs
How can retention metrics help improve my asynchronous videos?
Retention metrics offer valuable insights into how viewers interact with your asynchronous videos. By examining these metrics, you can pinpoint how long viewers stay engaged and spot moments where they lose interest. If your retention rates are high, it’s a sign that your content is hitting the mark. On the other hand, noticeable drop-offs might highlight areas needing tweaks, like improving pacing or making certain sections clearer.
You can also track patterns such as skipped sections or parts that viewers re-watch. These behaviors can reveal which parts of your content stand out as helpful, or fall flat. With this information, you can fine-tune your videos to better match what your audience wants, ultimately boosting engagement. Consistently reviewing and acting on retention data ensures your videos become more effective and engaging over time.
How does viewer engagement differ between mobile and desktop devices?
When it comes to viewer engagement, mobile and desktop users approach content differently. Mobile viewers often have shorter attention spans but show stronger emotional responses. This emotional connection makes them more inclined to share videos or react intensely. Since they’re usually watching videos while on the move, their interactions tend to be quicker and more impulsive.
Desktop viewers, however, engage in a more deliberate manner. They typically spend more time with content, exploring multiple pages and diving into detailed information. Their interactions with videos are often more focused and intentional. These contrasts underline the need to create video content that aligns with the unique habits and preferences of each device type.
How does integrating Zight with other platforms improve my video content strategy?
Integrating Zight with other platforms can make your video content process smoother and more efficient. With tools like real-time sharing, annotations, and interactive features, Zight helps you create engaging videos while keeping your team on the same page.
Connecting Zight to platforms like Slack, Microsoft Teams, or Jira allows you to share videos instantly, collect feedback quickly, and ensure your content reaches the right people at the right time. These integrations simplify collaboration and help you manage projects more effectively throughout your video creation journey.


