1. Segment your User Base
Segmentation can be used to test new hypotheses, as well as analyze data retrospectively.Benefits
You can analyze how different audiences engage with your content. Customized filters can help you quickly gauge the effectiveness of your content, and shift the direction of your marketing efforts.Instructions
1. Choose your audience 2. Go to the Behavior tab- click “All Pages” under Site Content 3. Click “add segment” to zoom in on a behavior like user bounce rate, followed by the red button “new segment” 4. Under the behavior tab, select the specific variable to help test your hypothesis 5. Name and save your segment 6. View data from the applied segment across that categoryHere’s a diagram for specifying segment details:
2. Customize Your Dashboard
Benefits
Working with the right dashboard in Google Analytics means that you’re in the driver’s seat. View your user data in the way that helps you efficiently gather valuable insights and makes most sense to you and your teammates. Widgets is a dashboards feature that lets you view your data based on preference. Widgets shape the way significant metrics are displayed and processed to better interpret metrics for a particular campaign.Instructions
1. Decide what kind of data you would like to analyze 2. Under the Customization tab, create and title your dashboard 3. Add a widget, or feature that modifies how the data in your report will be displayed. Widget categories can be more numerical or visual. Examples: Timeline, Geomap, Bar, etc. 4. Add segments 5. Choose dashboard layout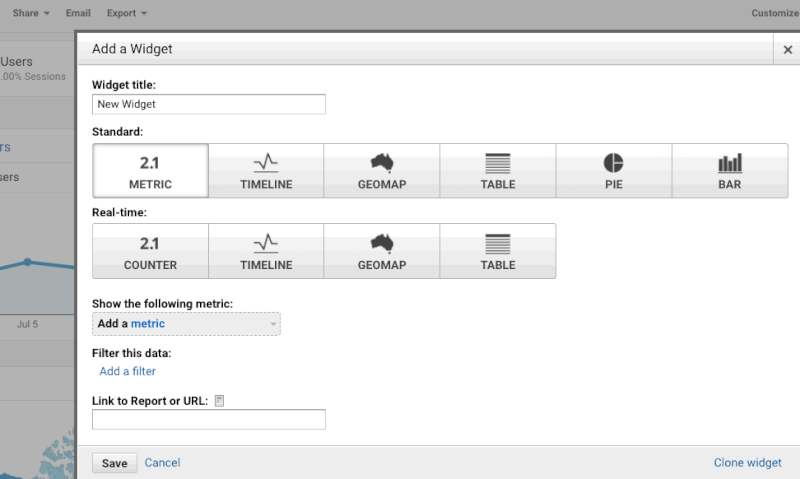
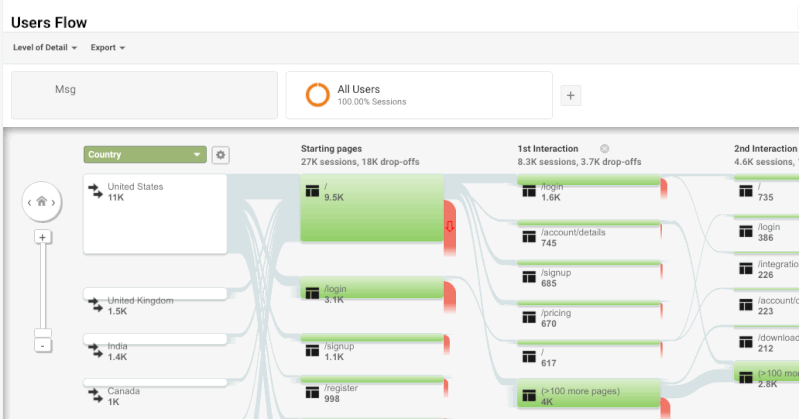
3. User Flow
Benefits
Ever wondered where and why a website drop-off occurs? Cue User flow! This feature lets you analyze the entire user journey on your site. User flow helps you recognize site imperfections, optimize different aspects of your site, and keep customers engaged. A Google Analytics expert user gave an example of an insight a marketer might find with User Flow: “A lot of people will view a page’s performance and think ‘wow, we have a ton of cart abandoners’, before looking into their site and realizing ‘wow, that button is so small.’” In that situation, User Flow can identify weak spots in design to prompt iterations that can result in more clicks, longer sessions, and purchases.Instructions
1. Under the Audience tab in the left sidebar, click “User Flow” to see a graph representation the site journeys of your users. 2. Choose a dimension to determine what kind of data is displayed for your flow report 3. Add a segment to break down the data across different factors for your audience. Cater segments by adding in values for equal to, less/greater than. 4. A microscopic look: Use Pan and Zoom feature to zero in on a particular part of the flow diagram, and hover over nodes to see a more specific breakdown of details 5. Sift traffic further: Specify different segments and change calendar dates to understand how sessions change across demographics and time. 6. Export your report.