If your idea of managing projects is making to-do lists, creating spreadsheets and juggling post-it notes, you’re doing it wrong.
Project management depends on several moving parts, making it critical to stay organized. A comprehensive project management plan will ensure that you’re communicating the purpose of the project while keeping everyone in the loop.
One of the most effective tools you can turn to for streamlining the process is visual project management. Why are visuals effective? That’s because our brains can process images in only 13 milliseconds, helping us interpret and retain information with ease.
Here’s how you can visualize your project plan to facilitate understanding and enhance collaboration.
1. Plan the schedule with a Gantt chart
If you’ve not used them, you’re sure to have come across them. That’s how popular Gantt charts are in the world of project management.
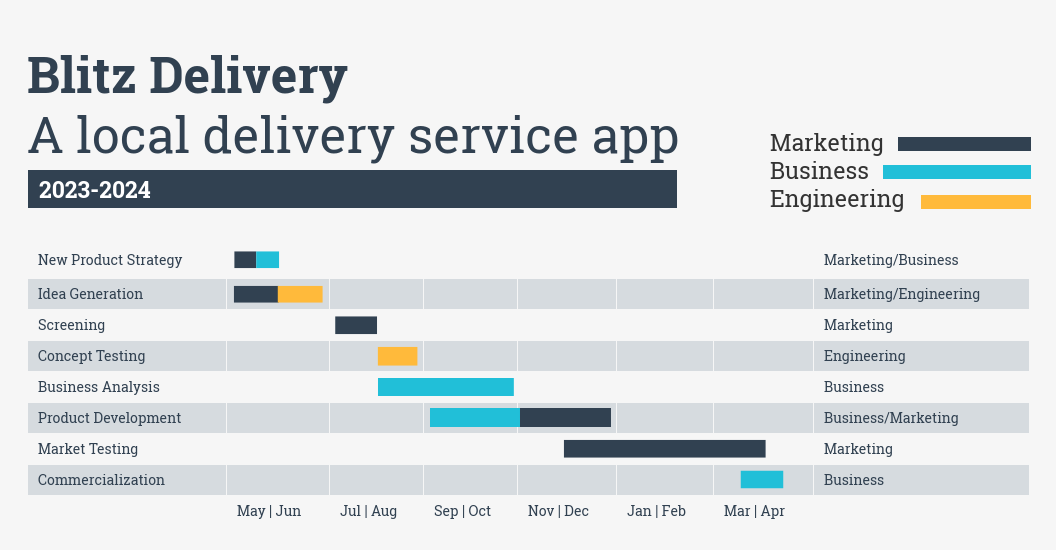
Every project begins with defining a schedule that consists of important tasks, milestones, and timeframes. A good way to visualize this information is by creating a Gantt chart.
One glance at this chart is enough to get clarity on where the project stands and if you need to make any improvements to meet deadlines. What makes it useful is its ability to condense the project’s tasks, resources and timelines into a single chart.
Take a look at this Gantt chart example which lays out the business development strategy for a delivery app. It lists the tasks and departments involved while clearly defining the timeframes.
Source: Venngage
2. Structure your team with an organizational chart
Organizing and structuring your team is vital for the project’s success. You need to allocate resources, communicate responsibilities and monitor performance so that everyone is aligned and working towards a common goal.
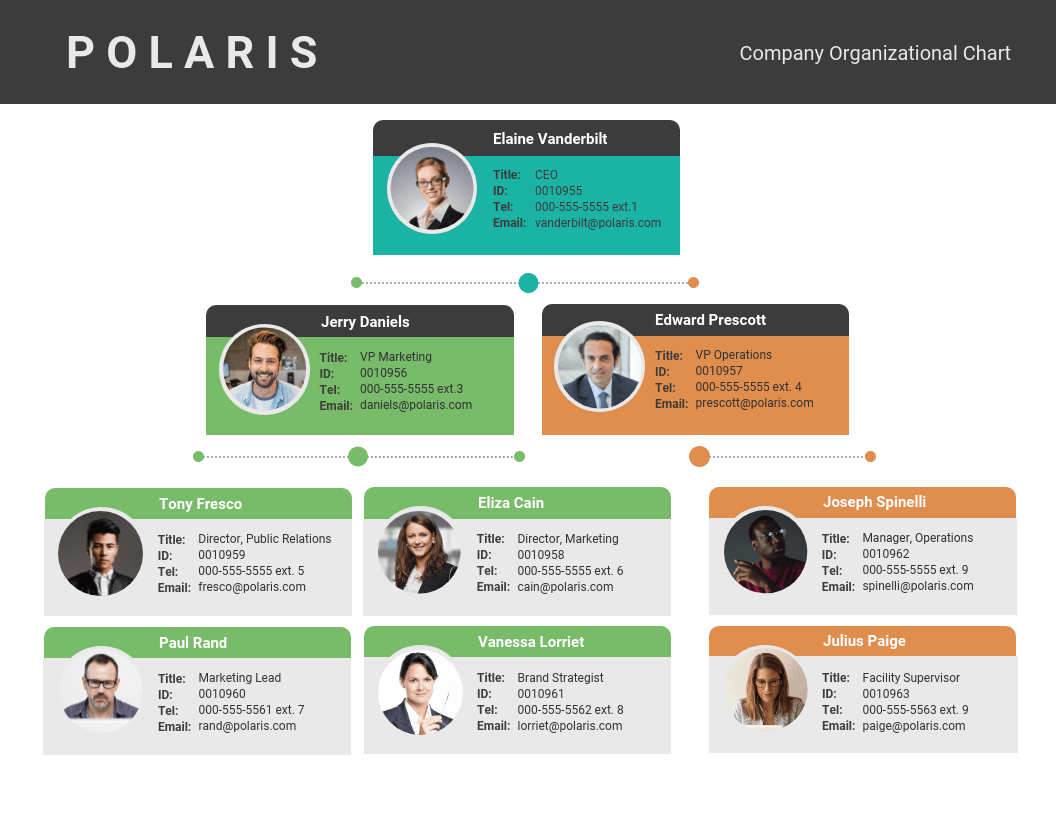
Instead of setting expectations verbally, use an organizational chart maker to document those expectations. This visual tool accurately represents the team structure while depicting the relationship between the various team members.
This is especially important for consultants or freelancers because it helps the client understand who’s responsible for what in the team.
Apart from stating basic details such as their name and contact information, you must also include their high-level responsibilities and channels of communication.
This makes it easier for you as a project manager to know what every team member is accountable for and assess resource gaps if any.
Here’s an example of an organizational chart that clearly shows the hierarchy and makes the right use of colors to differentiate between the teams. It’s also a good idea to include photos of team members to build trust.
Source: Venngage
3. Visualize data
What’s the best way to communicate complex project data? You can either write about it or present it visually.
The latter is always a better option because data visualization makes it easier for people to understand and digest data. It gives you the opportunity to tell a story in a creative, accessible way and keep readers engaged without intimidating them.
What’s more, when visuals are involved, there’s greater clarity, leaving little or no room for misinterpretation.
Here are the types of data visualizations you can use for better project management:
- Infographics
- Charts
- Diagrams
- Maps
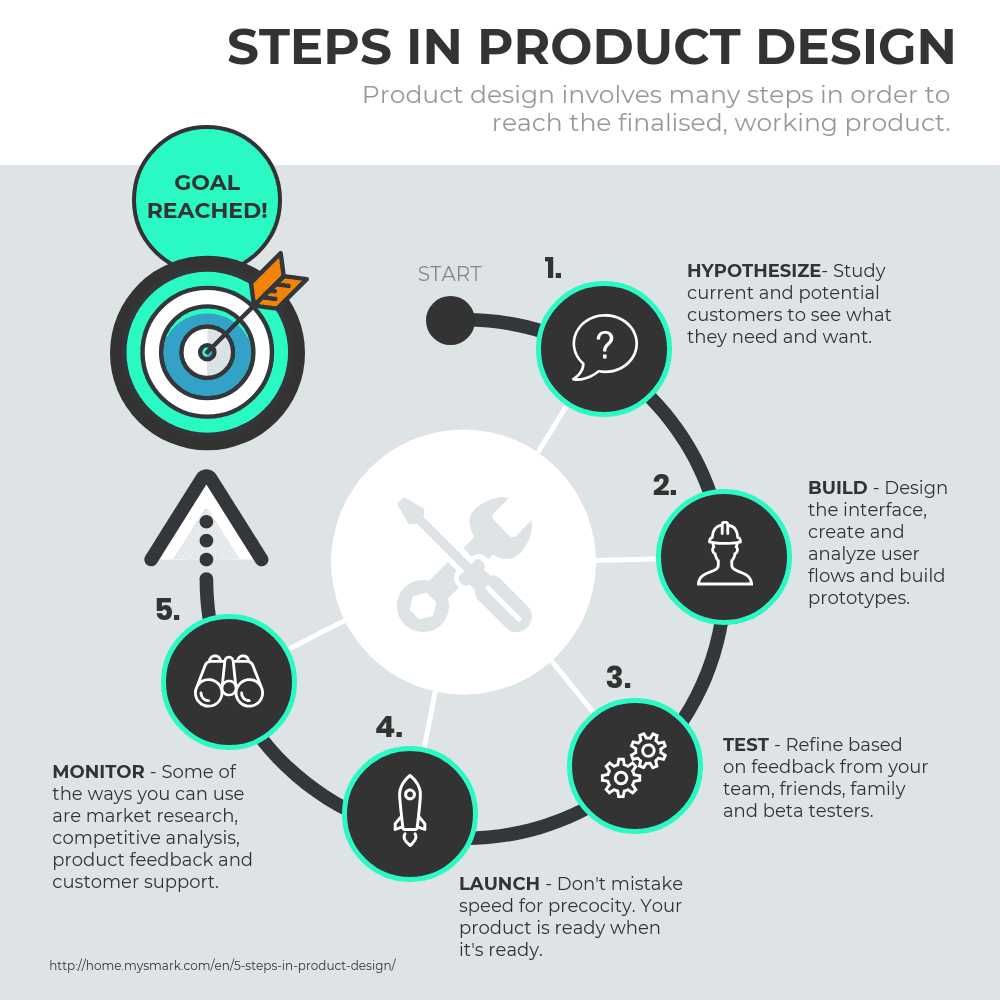
Take a look at this example of a process infographic that illustrates the different steps in product design with the help of icons while maintaining a consistent color scheme.
Source: Venngage
4. Assess risks with a risk breakdown structure
From poor cost estimations and running behind schedule to fluctuating market conditions — your project can encounter various types of risks along the way. Hence, it’s important to think about what could go wrong and be ready with a contingency plan.
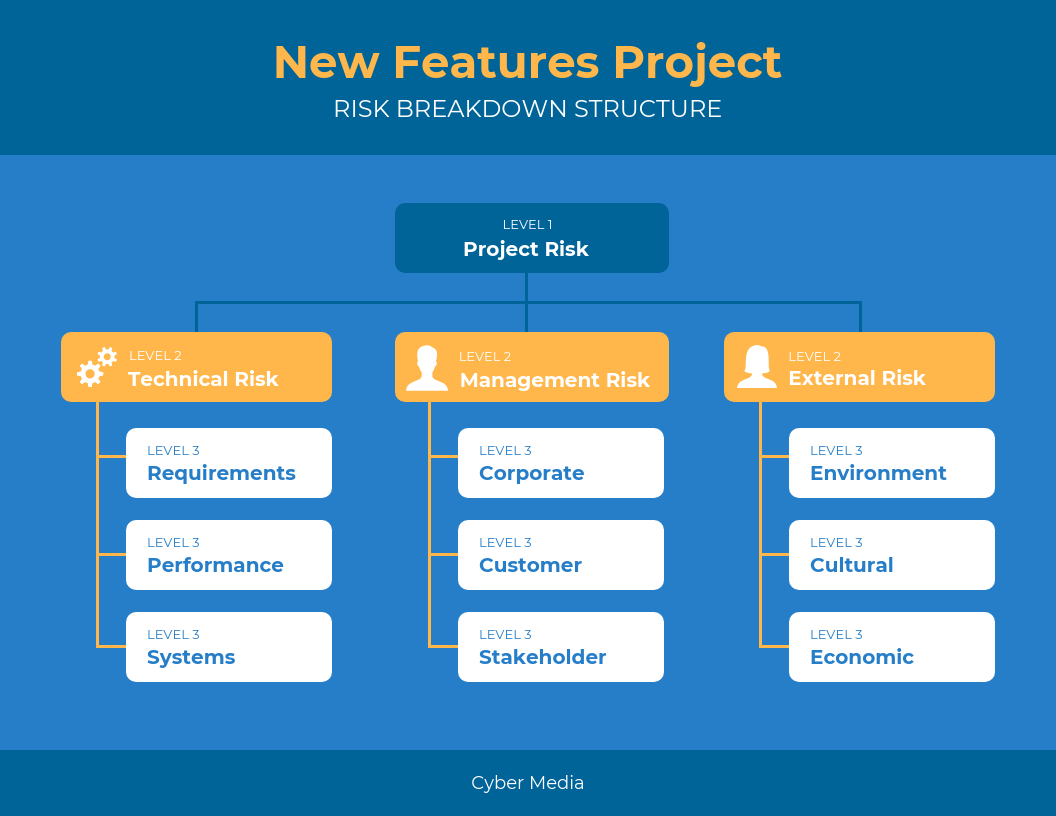
You can use a risk breakdown structure to illustrate this. Think of all the risks your project might encounter and place them under the following categories:
- External – risks that arise from outside the corporate structure
- Internal – risks that you encounter within the organization
- Technical – risks related to technology or infrastructure
- Project management – risks that you encounter during the implementation
Once you’ve identified the types of risks, you can organize them as per their risk level and individually assess each one of them to develop a backup action plan.
Take a look at this example of a risk breakdown structure that enlists the types of risks and categorizes them in the different buckets.
Source: Venngage
5. Track progress with a status report
Let’s say you’re working on a product development project and the senior management asks for a status update.
Instead of rushing to work on something at the last minute, why not keep a project status report template ready which can be updated and sent to stakeholders at the end of every week.
This is an effective way to professionally convey the status of your project and keep key stakeholders informed. You can include the following details in a status report:
- Project overview or summary
- Deliverables
- Milestones achieved
- Roadblocks encountered
- Upcoming tasks
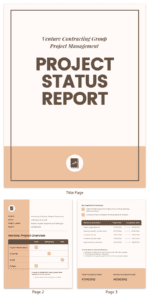
Here’s an example of a project status report that does a good job of summarizing accomplishments in a clear and consistent manner.
Source: Venngage
6. Reinforce information with icons
Just because project management plans are formal business documents doesn’t mean they need to be dull and boring. You should consider using icons to enhance project plans.
Apart from adding visual appeal, they are a great way to reinforce information while making it memorable and interesting.
Make sure the icons you choose are simple and complement the copy. Busy, unclear icons can do more harm than good.
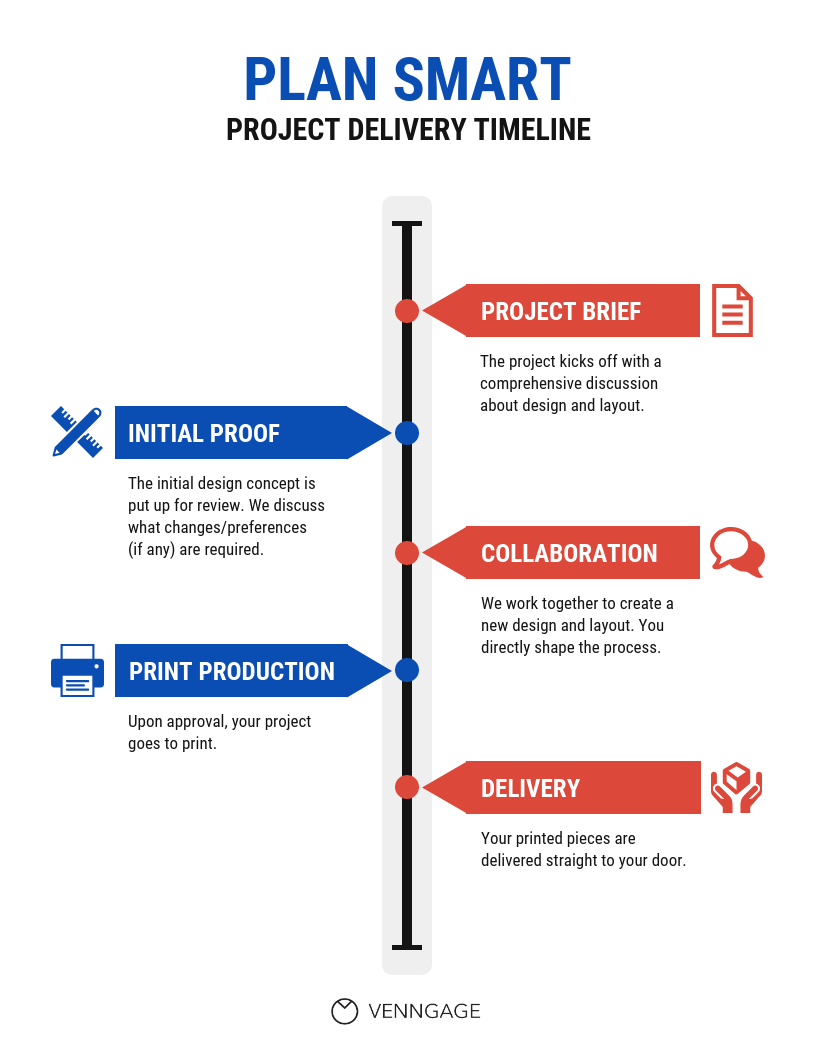
Here’s a look at a simple project timeline that uses icons. Notice how the icons quickly communicate the message and add value to the document.
Source: Venngage
7. Use color coding to communicate effectively
Another way to add life to your project management plans is by using colors. Color coding is a good tactic to draw attention to the important points, group elements, create hierarchies and differentiate information sections.
For example, you can choose a specific color to differentiate tasks, departments or timelines to help communicate and organize your ideas.
However, don’t make the mistake of going overboard with color. It’s important to select a consistent color scheme that helps the reader understand your point instead of confusing them.
It’s a good idea to choose a cool color (eg. blue, green, purple, etc.) for the background and use a contrasting, warm color (eg. red, yellow, orange, etc.) for key information.
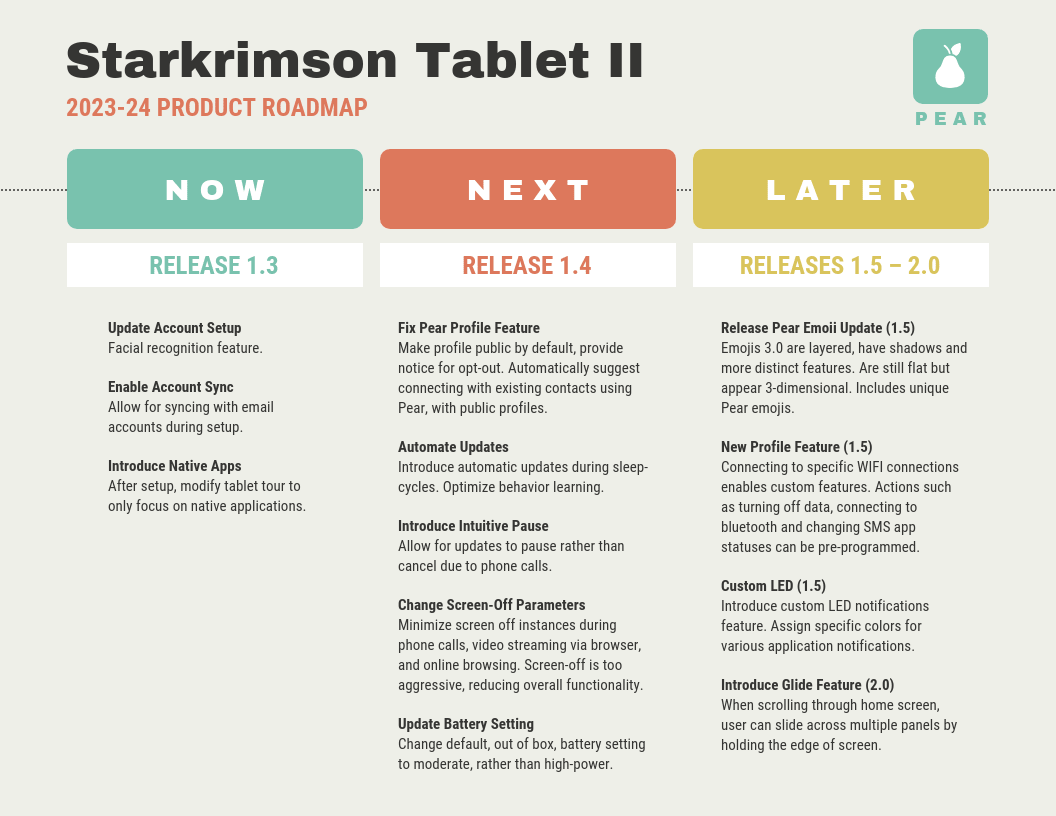
Take a look at this example of a product roadmap. They’ve used three different colors to highlight ‘now,’ ‘next’ and later.
Source: Venngage
The takeaway: visual project management
A huge part of managing a project requires you to be able to communicate effectively and efficiently. You need to ensure you’re communicating the right information to the right stakeholders at the right time.
Implementing visual thinking in project management lets you achieve that, especially at a time when you’re managing virtual teams. It also enhances team communication while ensuring everyone’s aligned in terms of goals and expectations.
So, use these visual project management tactics to plan and execute projects better, helping you get more done as a team and meet goals successfully.
____________________________________________________________________________
Simki Dutta is a content marketer at Venngage, a free infographic maker and design platform. When she’s not working, she can be found refreshing her Twitter feed and binge-watching Netflix shows. Find her on Twitter and LinkedIn.


