- Video Completion Rate: Measures how many viewers watch your video all the way through. High rates mean your content holds attention.
- Watch Time & Average View Duration: Tracks total viewing time and average time spent per viewer. Longer watch times boost platform visibility.
- Engagement Rate: Includes likes, comments, shares, and saves. Shows how much your audience interacts with your content.
- Click-Through Rate (CTR): Tracks how many viewers take action (e.g., visit your website) after watching.
- Audience Retention Rate: Reveals where viewers drop off or stay engaged throughout your video.
- Shares and Saves: Indicates how much value your content provides – shared videos spread your message, while saved ones show lasting relevance.
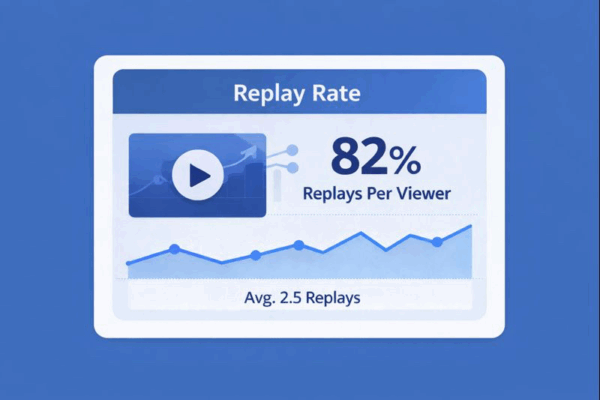
- Replay Rate: Measures how often viewers rewatch your video, reflecting its impact and value.
7 Social Media Metrics You Need to Track
1. Video Completion Rate
Video completion rate measures the percentage of viewers who watch your video from start to finish. Unlike surface-level metrics, this one reveals how effectively your content holds the audience’s attention all the way through.Gauges Engagement and Reflects Content Effectiveness
A high completion rate shows your audience is staying engaged, while a low rate might hint at issues like a weak opening, slow pacing, or an unconvincing conclusion. Videos with compelling storytelling, striking visuals, and a well-paced flow tend to perform better. Content that delivers clear value, like how-to guides or educational lessons, also keeps viewers watching. Plus, many social media platforms factor completion rates into their algorithms, meaning better rates can lead to wider exposure.Offers Insights for Improving Your Videos
Analyzing completion rates can help fine-tune your video structure. For instance, placing key information early in the video can reduce drop-offs and keep viewers hooked. Experimenting with different formats and pacing can also reveal what works best for your audience. Zight’s screen recording and editing tools are designed to help you craft engaging, well-structured videos. With features to trim unnecessary parts and tighten pacing, Zight ensures your videos hold attention from beginning to end. Up next, we’ll look at additional metrics that shed more light on your video’s performance.2. Watch Time and Average View Duration
Watch time measures the total minutes viewers spend watching your videos, while average view duration tells you how long, on average, people stick around before clicking away. These metrics go deeper than simple view counts, offering a clearer picture of how well your content holds attention.Measures Audience Engagement and Retention
Watch time builds on completion rates by showing whether your content truly connects with viewers or just grabs their attention momentarily. For instance, a video with 10,000 views but an average watch time of only 30 seconds suggests your content struggles to keep people engaged. On the other hand, a smaller number of views paired with higher watch time points to a more engaged audience. Platforms like Facebook and Instagram favor content with longer watch times in their algorithms. When viewers stay longer, it tells the platform that your content is worth promoting, which can lead to increased visibility. In short, higher watch times often mean better organic reach on social feeds.Shows Content Effectiveness and Quality
Average view duration pinpoints where your audience starts losing interest. If viewers drop off after 15 seconds, your intro might need to be more engaging or concise. On the flip side, if viewers stick around for 80% of a two-minute video, it’s a sign that your content is delivering value and keeping their attention. Different types of videos naturally have varying watch time trends. Educational videos often hold viewers longer as people look for specific information, while entertainment videos might see shorter but more intense bursts of engagement. Recognizing these patterns allows you to adjust pacing and length to better match what your audience expects.Provides Actionable Insights for Optimization
Watch time data is a goldmine for refining your content. It helps you identify your audience’s preferred video length and reveals the moments where viewers tend to drop off. For example, if most viewers leave around the one-minute mark, you might want to move your key message earlier or add an attention-grabbing hook at that point. Small tweaks like these can significantly improve retention. Zight’s analytics tools make it easy to track these patterns across your videos. By analyzing how long viewers stay engaged with your screen recordings and tutorials, you can fine-tune your approach to create more engaging content that keeps people watching until the very end. Up next, we’ll dive into how engagement rates can further sharpen your video strategy.3. Engagement Rate (Likes, Comments, Shares, Saves)
Engagement rate measures how actively your audience interacts with your videos beyond just pressing play. This includes likes, comments, shares, and saves. Unlike passive metrics like views, engagement rate reflects how inspired viewers feel to take action after watching your content. When viewers engage, whether through a like, comment, share, or save, they’re doing more than just consuming; they’re participating in your brand’s story. A high engagement rate suggests your content strikes a chord with your audience, motivating them to connect and respond. Not all forms of engagement carry the same weight. A simple like takes little effort, but a thoughtful comment or a share shows a deeper connection to your message. Saves, on the other hand, indicate that your content holds long-term value, as viewers plan to revisit it. Comments, in particular, tend to amplify reach since they spark discussions that keep people returning to your post.Reflects Content Effectiveness and Quality
The type of engagement you receive reveals what’s truly working in your content strategy. Videos that generate a lot of comments often address topics that spark conversation or pose direct questions to viewers. Content that’s widely shared typically offers something practical, entertaining, or informative, something people feel compelled to pass along. Engagement patterns also highlight which formats resonate most with your audience. For instance, tutorial videos might lead to more saves as viewers bookmark them for future use, while behind-the-scenes clips often encourage comments, fostering a sense of connection with your brand. Paying attention to these trends helps you fine-tune your approach to better align with audience preferences.Offers Insights for Strategic Adjustments
Engagement rate data provides a roadmap for refining your content strategy. By identifying which topics, formats, and posting times generate the most interaction, you can tailor your content to maximize impact. For example, if how-to videos consistently drive high engagement or certain times lead to more activity, you can adjust your schedule and content mix accordingly. It’s not just about the number of interactions but the depth of them. Meaningful comments, those that ask questions or share personal stories, indicate that your content is fostering genuine connections. Tools like Zight can help you create tutorials and other engaging content that naturally prompt discussions and shares. These insights, along with other key metrics, can shape a more effective video strategy moving forward.4. Click-Through Rate (CTR)
Click-through rate (CTR) measures the percentage of viewers who take a specific action after watching your social video, like visiting your website or signing up for a service. It reflects how effectively your video content inspires viewers to go beyond passive watching and engage with your brand in a meaningful way. A strong CTR is a clear sign that your content resonates and motivates action. Unlike metrics that track interactions within a platform, CTR highlights how well your video drives viewers toward broader marketing goals. When someone clicks through, they’re signaling genuine interest in learning more about what your brand offers.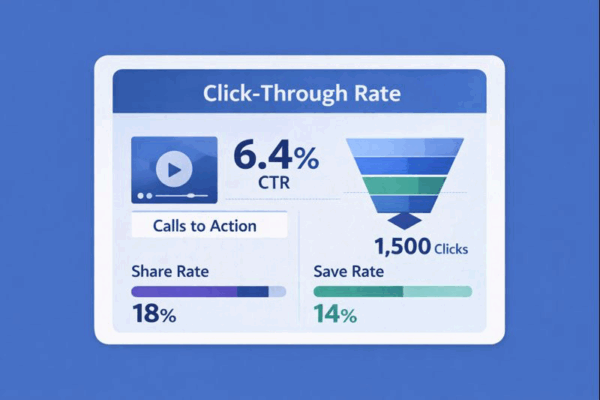
Indicates Content Effectiveness
A high CTR is a strong indicator that your video communicates value effectively and sparks interest in your product or service. Videos with strong click-through performance often share certain traits: they clearly outline benefits, address specific pain points, or provide engaging demonstrations that leave viewers wanting to know more. To boost CTR, seamlessly integrate your call-to-action (CTA) into the narrative. Place it strategically, ideally when the video transitions from identifying a problem to presenting a solution. Content format also plays a role in driving clicks. Tutorials, product demos, and behind-the-scenes content often perform well because they balance providing value with leaving viewers curious for more. When your video aligns with the audience’s needs or interests, they’re much more likely to act.Offers Insights for Improvement
CTR data not only measures success but also highlights areas for improvement, helping you refine your video content to drive better results. For instance, a video with low views but a high CTR suggests that while your content resonates with the right audience, it may need better promotion to reach more people. Experimenting with different CTAs can also provide valuable insights. Some viewers respond to direct phrases like “Learn more” or “Get started”, while others prefer softer language like “Discover how” or “See what’s possible.” Timing matters too, some videos benefit from an early CTA to capture attention, while others perform better when the action step is presented after building anticipation. By analyzing how your video content impacts CTR, you can develop more targeted strategies for consistent success. Tools like Zight can simplify the process of creating video content with strong CTA integration. Whether you’re recording tutorials, showcasing products, or providing step-by-step guides, platforms like Zight help you craft videos that inspire action. Tracking which types of content generate the highest CTRs allows you to refine your approach and create videos that not only engage but also drive measurable outcomes. CTR insights don’t just show immediate results, they complement other performance metrics, offering a clearer picture of your video’s overall impact.5. Audience Retention Rate
Audience retention rate is a powerful metric that goes beyond just counting views, offering a clearer picture of how well your video content holds viewers’ attention. It tracks how long people stay engaged with your video and pinpoints the moments they lose interest. This data helps you understand which parts of your video captivate viewers and which might be falling flat. Unlike total views, retention rate provides a detailed look at engagement throughout the entire video. For example, if a video has 80% retention at the 30-second mark, it means 8 out of 10 viewers who started watching were still engaged at that point.Measures Audience Engagement and Retention
A high audience retention rate signals that your content consistently delivers value and keeps viewers interested from beginning to end. Social media platforms tend to reward videos with strong retention rates, as their algorithms prioritize content that keeps users engaged longer. The first 15 seconds are especially critical because this is when viewers decide whether to keep watching or move on. A compelling hook in those opening moments can significantly boost retention. Content like tutorials, educational videos, and storytelling formats often perform well because they promise and deliver specific results. Retention benchmarks also vary depending on the platform and video length. For instance, shorter videos on platforms like TikTok may achieve retention rates of 70-80%, while longer YouTube videos might see 40-50% retention and still be considered successful. Knowing these platform-specific norms helps you set realistic expectations for your content.Shows Content Effectiveness and Quality
Retention data also sheds light on how effective and engaging your content is. Sharp drops in retention at specific points can indicate where your video loses momentum, while steady retention suggests your pacing and messaging are working well. Sudden dips in retention might point to issues like a slow introduction, confusing sections, or content that doesn’t meet viewer expectations. On the other hand, videos with smooth retention curves often feature clear structures, engaging visuals, and a natural flow that keeps viewers watching until the end. A gradual decline in retention is usually a sign of viewers naturally finishing the video, while abrupt drops signal areas that need improvement. Videos with multiple peaks in their retention graphs often include standout moments that encourage rewatching or sharing.Provides Actionable Insights for Optimization
Retention analytics offer concrete guidance for improving your future videos. Identifying drop-off points allows you to adjust your pacing or refine your messaging to better align with audience preferences. For example, if retention drops sharply after your introduction, you might need to make your opening shorter or more engaging. If specific segments lose viewers, consider presenting that information in a more dynamic way – or reevaluate its importance to your overall message. Tools like Zight can be invaluable for creating more engaging videos. They allow for quick edits and adjustments based on retention feedback, making it easier to refine tutorial pacing, enhance product demonstrations, or improve instructional content. This flexibility enables you to test and optimize your videos for better retention rates. Retention insights are even more powerful when paired with other engagement metrics. For instance, if a video has moderate retention but high replay rates, it might indicate that viewers find the content worth revisiting. Conversely, strong retention but low click-through rates could mean your call-to-action needs work. Together, these insights can guide you in fine-tuning your overall video strategy for maximum impact.6. Shares and Saves
Shares and saves represent the peak of viewer engagement. When someone shares your video or saves it for later, it shows they see real value in your content, enough to recommend it to others or revisit it themselves. Alongside likes and comments, these actions provide deeper insights into how much your audience values your work.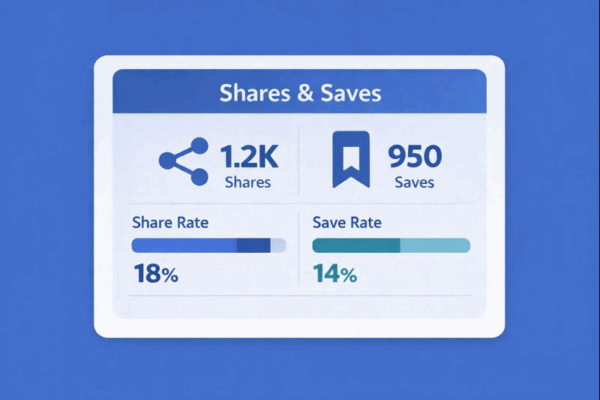
Reflects Content Quality and Impact
Shares and saves go beyond surface-level interactions to reveal how much your content resonates. A high number of shares and saves signals that your video connects deeply with viewers and offers something meaningful. When someone shares your video, they’re essentially vouching for it within their network, tying it to their personal reputation. This kind of endorsement shows your content is not just engaging but also worth sharing. Saves, on the other hand, highlight the lasting value of your content. Viewers save videos they want to revisit, whether it’s a tutorial, a recipe, or an inspiring message. This is especially common for educational or resourceful videos that people use as references. The type of content often determines how people engage with it. Fun, entertaining clips tend to get shared quickly, while educational or informational videos are more likely to be saved for later. Recognizing these patterns helps you understand if your content is hitting its mark.Practical Takeaways
Digging into your share and save data can reveal what your audience values most, helping you refine your content strategy. Videos with high save rates often offer practical, actionable takeaways, like tutorials or step-by-step guides. If this is what your audience loves, you’ll know to create more content in this style. Shares, on the other hand, are often driven by emotional reactions. Videos that inspire, surprise, make people laugh, or even spark debate are more likely to be shared widely. By identifying which emotions drive shares among your audience, you can design content that taps into those same feelings. Timing also plays a role. Videos saved immediately often serve as reference material, while those shared over time might have a timeless appeal. Recognizing these trends can help you fine-tune your posting schedule and promotional efforts. Pay attention to the comments and captions viewers include when they share your videos. These can provide valuable clues about what struck a chord with them and why. This feedback can guide your future content decisions and help you understand what motivates your audience to engage.7. Replay Rate
Replay rate tracks how often viewers rewatch your video, offering a clear measure of its ability to hold attention and sustain interest over time. While other engagement metrics focus on single interactions, replay rate highlights your content’s lasting appeal. When someone replays your video, it’s a strong signal that they found value in it. Maybe they missed a detail, wanted to clarify information, or simply enjoyed it enough to watch again. This behavior reflects not just attention but also the quality of your content, making replay rate a key indicator of engagement.